As I mentioned in my last post, this summer, I assisted in research by Dr. Kalhor at the Princeton’s Center for Policy Research on Energy and the Environment (C-PREE) in examining the effect of anomalous weather on economic activity as part of an internship funded by the High Meadows Environmental Institute (HMEI) at Princeton University. While my previous post focused on my insights in preparing for internships to maximize your experience, in this post, I want to focus on one of the technical challenges that I faced during the internship: (a) handling big data; and (b) one of the powerful tools that we have as students at Princeton students to handle large amounts of data – Princeton’s large computing clusters.
During my internship, I formulated a model that examined the effect of extreme weather on business activity using a panel data set (in other words, data where observations are for the same subjects each time) of many American businesses and a proxy (that is, a variable that is introduced and used instead of the variable of interest that cannot be measured directly) for their business activity taken over time. As it turned out, this data set was extremely large – even after cleaning the dataset and removing businesses that did not fit the criteria of my work, there were more than 170,000 businesses with over 400 data points each for each variable. Predictably, when I asked my laptop to run even a basic fixed effects regression, it refused as there was simply not enough memory.
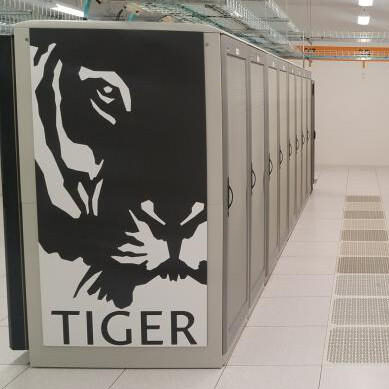
Luckily, as I mentioned before, Princeton students have a powerful tool to handle this issue – our remote computing clusters. Princeton has several clusters of varying sizes. As students, we have access to the smallest two – Adroit and Nobel – although access to larger clusters may be possible if you are working as part of a research group under a Princeton faculty. Of course, it should be noted that while these are the smallest clusters, they are by no means small – Adroit gives you access to about 375 GB of RAM!

Since I used Adroit in my internship, I will primarily discuss how to use it in this post. I found that Adroit was more than capable of handling my needs despite my relatively large data set – and it even has multiple cores that can be used by students engaging in parallel jobs – but a list of the larger clusters is available here for students who can access them.
In order to access Adroit, all you have to do is submit a registration form with your student information and the reason you are using Adroit. I should mention that Adroit is a resource available to you even outside of research internships, and you can even use it for course work as is recommended in Adroit’s information page.
Once you have access to Adroit, you can take advantage of its capabilities through two different interfaces – either through the graphical interface (at https://myadroit.princeton.edu) or through your command line (type ‘ssh <NetID>@adroit.princeton.edu’ to access Adroit: on macOS, this will be through Terminal and via the command prompt on Windows). Make sure that if you are off-campus, you are using one of the Princeton VPNs. Once this is done, you just have to request the number of cores (as Princeton’s cluster computing site explains, a “core” is subunit of a processor or CPU, and can be thought of as a logical unit of processing power that you can effectively “rent” for your processing needs) and amount of memory you need (in the website interface, this is done in the “My Interactive Sessions” tab, while in the command line, you need to use the ‘Salloc’ command). I requested an initial number of cores and some amount of memory and then found out (through trial and error) the largest dataset that R could work with those resources. Since I knew the amount of data I would finally be working with – in other words, how much larger it was compared to this “initial dataset” – I then requested that multiple of my initial request for my final statistical analysis. Obviously, your requirements might vary depending on how compute-intensive or data-intensive your analysis is and also on the complexity of your algorithms.
While both the graphical and command-line interface are perfectly viable for accessing Adroit and neither offers any technical advantage over the other, from my personal experience, I would recommend using the graphical interface for most tasks. I found that it was generally easier to perform logistical tasks like store files or install packages as well as visualize data in graphs – and as someone who is used to using RStudio, it was much more comforting to see that familiar interface rather than the black and white command line. The only exception I found was when the amount of memory requested was very high, running the code using the command line was more effective than trying to run it using the online interface. This, however, was very rare and seemed to occur randomly and thus may have been a problem with my computer. Nevertheless, if your code does not seem to run in one interface, it may make sense to try it in the other!
As I mentioned before, Adroit was an immensely powerful and helpful tool that allowed me to estimate econometric models using the large data set that I had access to. From now on, it will be one of my go-to tools for attempting to handle big data, and I hope that as you navigate through your internships and complete other projects, it will prove to be just as valuable for you.
– Abhimanyu Banerjee, Social Sciences Correspondent

