Reilly Bova ’20 is a Bachelor of Science and Engineering (B.S.E) Computer Science (COS) major with a strong interest in Physics. He spent this past summer conducting research in Princeton’s Physics department. His work included the visualization of deep universe galaxy clusters.

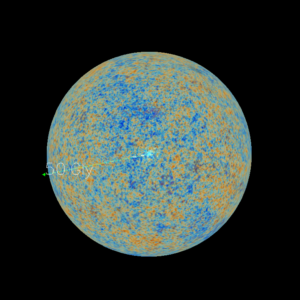
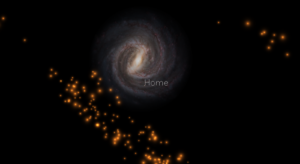
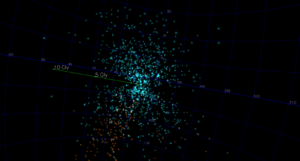
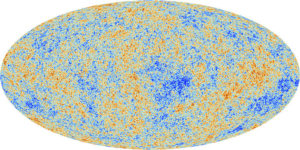
Reilly took data on some of the oldest and farthest discovered galaxies (several billion light-years away) and mapped them onto a computational model of the observable universe. He also added to the visualization extremely precise maps of the Cosmic Microwave Background (CMB), which is radiation from about 380,000 years after the Big Bang. Right after the Big Bang, the universe was so hot that nothing—not even photons—could travel unimpeded, which rendered the universe opaque. Around year 380,000, the universe had cooled enough that neutral atoms could form, rendering it transparent (i.e., photons could now travel through it) and releasing an enormous amount of energy which we now call the CMB. This Cosmic Microwave Background has been traveling through the universe for billions of years. As the universe expands, the wavelength of the CMB radiation lengthens (i.e., “redshifts”). We can generate a map of what the universe looked like very early in its life by measuring these redshifts.
I recently had the exciting opportunity to interview Reilly and find out more about his research experience.
How did you find this summer research opportunity?
I took PHY105 with Professor Lyman Page last year, which I really enjoyed. As a COS major, I wanted to find research that was at the intersection of Physics and Computer Science. When I approached Professor Page, he proposed this project. The project allowed me to keep my programming skills robust while also exercising my creativity. At the end of the summer, I even got to turn my visualization into a video about the observable universe, complete with exciting zooms in and out and animated galaxy clusters!

How were you able to conduct this research at Princeton?
Princeton allows students working for the University to live on campus in upperclassman housing. Professor Page approved me as a paid employee of the Physics department, and as a result I was authorized to live on campus. Overall, the process was pretty straightforward.
What did you learn from your research?
The research exposed me to a lot of new things: astrophysics concepts, the CMB, thermodynamic principles, and some basic applied computational geometry. There were around 10 students working on various projects in the same lab as me, and we each presented our progress every Friday, so I was exposed to many interesting physics projects. While the research itself was conducted individually, the whole experience was extremely rewarding socially since I got to spend time discussing physics with really intelligent, passionate students.
What made the experience stand out to you?
I love being able to manage my own schedule and projects; I felt that I had a lot of freedom to do so this summer. I had more or less complete creative control over the multimedia and presentation aspects of my work, and I got to learn a lot on my own as a result of the project. For example, I was given three variables that defined where each galaxy cluster was located in the sky—longitude, latitude, and redshift—and I had to figure out how to translate them into an actual location. Longitude and latitude were easy, but I had to find and understand the correct formulas to convert the redshift data into radial distance from the earth. You have so much data, and if you think about the Milky Way, it’s 50 or 100 kilolight-years in diameter, and you need to be able to show that in a reasonable scale. But then you also have to show the edge of the observable universe and zoom out beyond it, which is gigalight-years in scale, so it was a long process simply finding a program that could represent different orders of magnitude well on an astronomical scale.

Tell me something awesome you learned.
When looking at a map of the CMB, hotter regions (i.e., those with a higher temperature than the average) are shown in orange and cooler ones in blue. Inside some hotter regions, we can actually see little blue dots. These represent regions in which the ubiquitous radiation was blocked by a dense body—in other words, these are the origins of galaxies. The amazing thing is that we can find these blue dots on the CMB map and then look up into the sky in the corresponding locations and see these ancient galaxies.

It’s clear from Reilly’s research that even as rising sophomores, Princeton students can take part in significant, exciting research. I hope this will inspire those of you who are interested in research to seek out your own opportunities!
— Alexandra Koskosidis, Engineering Correspondent

