“Big data” and “data science” are some of the buzzwords of our era, perhaps second only to “machine learning” or “artificial intelligence.” In our globalized, Internet-ized society of plentiful information galore, data has become perhaps the most important commodity of all. Across all kinds of academic disciplines, working with large amounts of data has become a necessity: universities and corporations advertise positions for “data scientists,” and media outlets warn ominously of the privacy risks associated with the rise of “big data.”
This isn’t an article that discusses the broader, societal implications of “big data,” although I highly encourage all readers to learn more about this important topic. Instead, I’m here purely to provide you some (hopefully) broadly applicable tips to working with large amounts of data in any academic context.
In my own field of climate science, data is paramount: researchers work with gigantic databases and arrays containing millions of elements (e.g., how different climate variables, such as temperature or precipitation, change over both space and time). But data, and opportunities for working with data, are present in every field, from operations research to history. Below is an overview of some existing data operation tools that can hopefully assist you on your budding data science career!
Python
To begin talking about working with data, we must surely begin with Python. Python is ubiquitous in the data science world. It’s an extremely versatile high-level programming language with a relatively simple syntax, making it perfect for all kinds of applications in the data world. But where Python truly shines, and what makes it the most important data science programming language, is its extensive collection of libraries. These libraries have all sorts of built-in methods with a diverse range of functionalities, so you don’t have to write your own implementation from scratch! Here, I’ll discuss a couple of those libraries, Numpy and Pandas: but know that this is barely scratching the surface of what Python has to offer!
Numpy

An example use case of Numpy
Numpy is a library specifically designed for working with large amounts of data. It provides a functionality to Python for efficiently working with large, multi-dimensional arrays and matrices, as well as mathematical functions that can operate on these arrays: everything from simple addition to Fourier transforms. Additionally, there are methods to deal with every form of array manipulation you can conceive of, whether it’s combining, duplicating, or doing anything to any number of arrays. What all of this boils down to is a nearly unlimited capacity to manipulate vast amounts of data, with scalable performance and efficiency: an incredibly powerful tool. To build on your work with Numpy arrays, and venture more into the realm of visualization, correspondent Alexis has a great piece published on working with the library Matplotlib!
Pandas

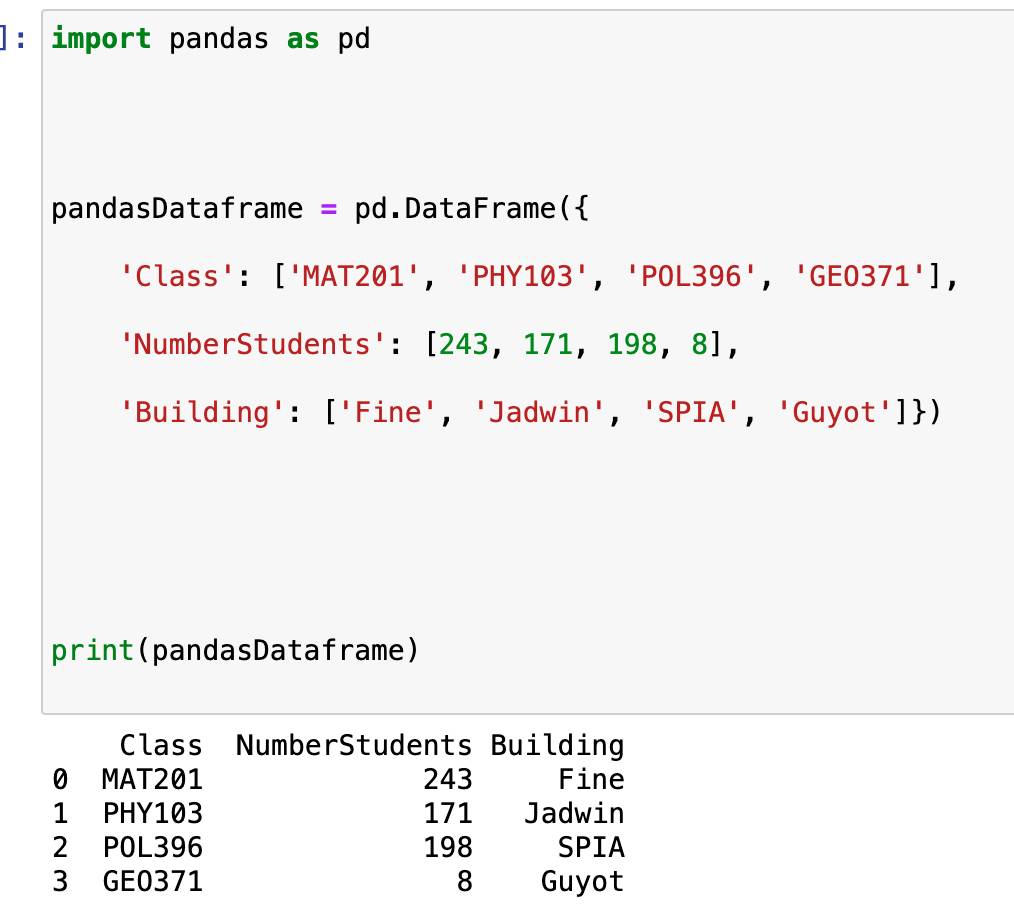
An example use case of Pandas
Pandas is another Python library targeted towards people working with large datasets. While it’s quite similar to Numpy, the two libraries contain important differences, and are best suited for slightly different sets of tasks. While Numpy focuses on numeric computation, Pandas is more of a structural and an organizational tool. It’s important to note, furthermore, that Pandas is a lot slower than Numpy (but that’s not to say it doesn’t scale very efficiently in its own right). Thus, while Numpy is probably your best bet for working with large amounts of raw numerical data, Pandas has more diversity in its use cases: you can work with non-numeric, tabular, and time series data, just to name a few! While Numpy allows you to dig into the weeds of operating on the data itself, Pandas is more of a data analysis and visualization tool.
Now, we’ll move on to some alternate “big data” tools that exist outside the Python framework!
Tableau

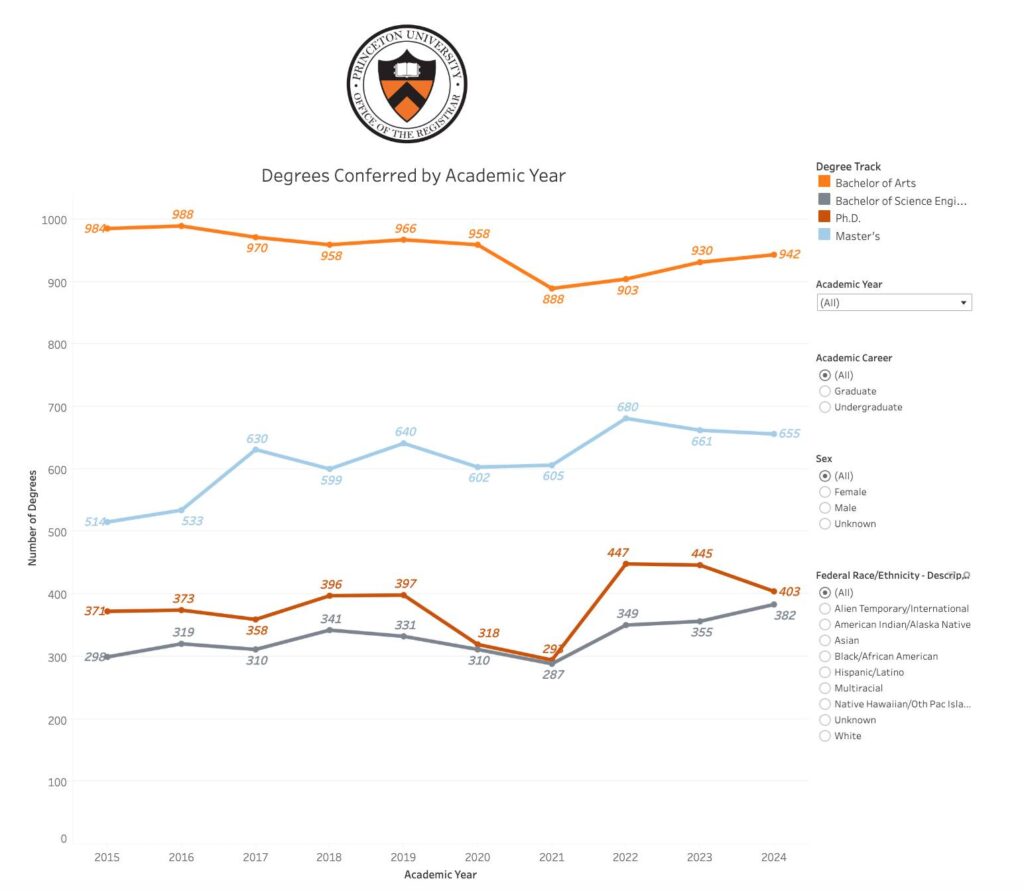
Tableau is a very powerful tool for data visualization. When dealing with big data, a major challenge is interpretability: how do you actually interpret the meaning of the vast spreadsheets or arrays you’re manipulating? In my case, these often correspond to climate maps of the globe. But there are so many ways to visualize these data: from maps to pie charts. Tableau allows you to visualize the data stored in various data structures, such as spreadsheets or databases—making it a perfect tool to communicate and understand your analyses!
In conclusion, there are plenty of free, powerful tools that enable you to work effectively with massive amounts of data. These tools—of which I barely scratched the surface in this introductory post—can be applied to tons of different contexts in all kinds of academic disciplines. Hopefully this post inspires you to consider working with big data, whatever your field might be!
— Advik Eswaran, Natural Sciences Correspondent

