
For my fellow seniors – the end is in sight.
At least in theory, we’re at that stage when we’re polishing up our theses, making sure that our words make sense and our figures are intelligible.
But, it is also important to make sure that our theses look nice – nothing shouts amateur more than a pixelated figure hastily scribbled freehand in MS Paint.
Don’t know where to begin? You’ve come to the right place. Below I’ve briefly outlined a few quick tips to making your thesis look like the work of a seasoned professional… even if it’s not. Some examples are tailored more toward those with quantitative data, but hopefully there is enough below to be useful to anyone, whether you’re making bar graphs, diagrams, or anything in between!
- While it is possible to create great flow charts or diagrams with a program such as MS Paint, you will need to look to more advanced vector graphics programs if you want to go to the next level. These programs allow you to create and manipulate shapes and lines to create and edit publication quality images. My personal preference is Adobe Illustrator – if you don’t have the dough to purchase it yourself, luckily for you, Princeton does, so go to a cluster computer and use it there.
- Why use a vector graphics program? Because the control it gives you over all of the individual objects in your figure is unparalleled. It can align objects with ease, give you total control over the color and dimensions of every component of your objects, allow you to make some objects semi-transparent… the list is endless.
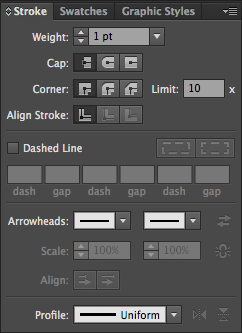
Control every aspect of every line. - Another key feature of many of these vector graphics programs is the way they organize your figure into layers. This is just another level of control that I highly recommend you learn to use – it gives you the ability to show, hide, and edit layers individually.
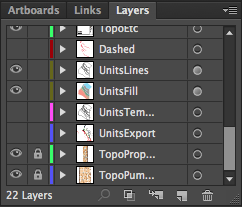
Layers allow you to organize the different components of your work with ease. - There may be occasions when you are looking to modify a .png or .jpg from another source – perhaps when you’re adapting a figure from another source, or when you’re unsatisfied with the ugly output of another program. Adobe Illustrator has the ability to “trace” figures for you! Although it may not work perfectly for complex images, it provides an excellent starting point for converting external images into malleable vectors.
- Finally, if you’re working in Matlab: when saving images as .png or .jpg, you may notice that the output is rather pixelated, especially if you zoom into these figures. The workaround? Save your figures as .eps instead! Then, if required, you can easily convert them to .png or .jpg using Preview for Mac users, or any of the free-to-download programs found on Google for Windows users.
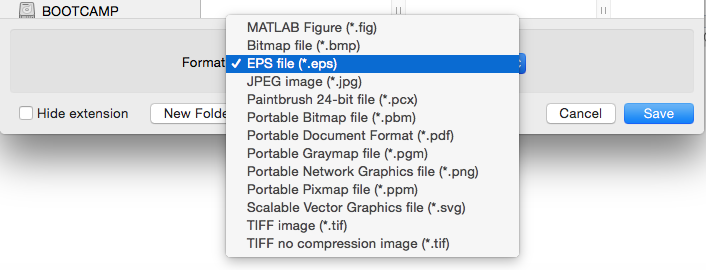
Save your Matlab figures as .eps
Unfortunately, an in-depth tutorial on vector graphics is beyond the scope of a short blog post, and so I was instead hoping to provide you with a good starting point. So if that sounded like a whole bunch of unintelligible jargon, I would highly recommend Google-ing introductory tutorials to Adobe Illustrator. The results are worth it! Not only will your figures be clearer and easier to understand, but your thesis will look worthy of your culminating work at Princeton.
– Yuem Park, Natural Sciences Correspondent
