Last year, Princeton announced a plan to expand the University by 2026, adding another residential college and building new athletic facilities on the south side of Lake Carnegie. In what ways will this latest expansion transform our campus, and how does that change fit with the university’s historic land use? These are the questions that my twin brother, GEO senior Benjy Getraer, set out to answer last year in a class project for GEO 90 “Analyzing Ecological Integrity: An Assessment of Princeton’s Natural Areas.”
Research often involves a spatial dimension–you want to find out not only what is happening but also where. This is an important component in many disciplines: political scientists want to know how voting results breakdown by precinct or change over time; linguists may want to understand how dialects vary regionally; climate scientists want to know how much different parts of the globe are warming.
To address these types of large-scale research objectives or answer smaller questions such as Benjy’s, you can use Geographic Information System (GIS) software to display, edit, and analyze geospatial data. Spatial analysis provides a unique way to study data and add diversity to figures and data visualization. In this post I will introduce basic concepts of geospatial data and one application of GIS analysis by walking through Benjy’s project, mapping land use change on Princeton’s campus.

Raster Data: Campus Imagery
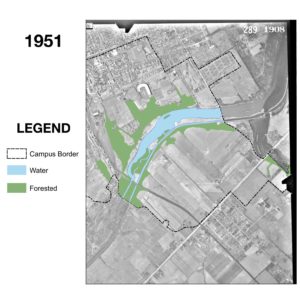
To map Princeton’s campus, Benjy worked with overhead imagery of Princeton Campus taken between 1940 and 2018. Using ArcGIS, he georeferenced these raster images by defining their geographic location so that they could be mapped correctly. Rasters represent continuous two-dimensional data as discrete grids with a specific resolution, defined by the size of pixels within the grid. Surface elevation, population density, and imagery are examples of common raster datasets. Georeferenced rasters are mapped in a specific location, defined by the coordinates of the grid extent. Raster data are fundamental to spatial analysis and can be found for free online. However, large rasters can be many gigabytes of data and are often difficult to store and work with on laptops.

Shapefiles: Land Use Classifications
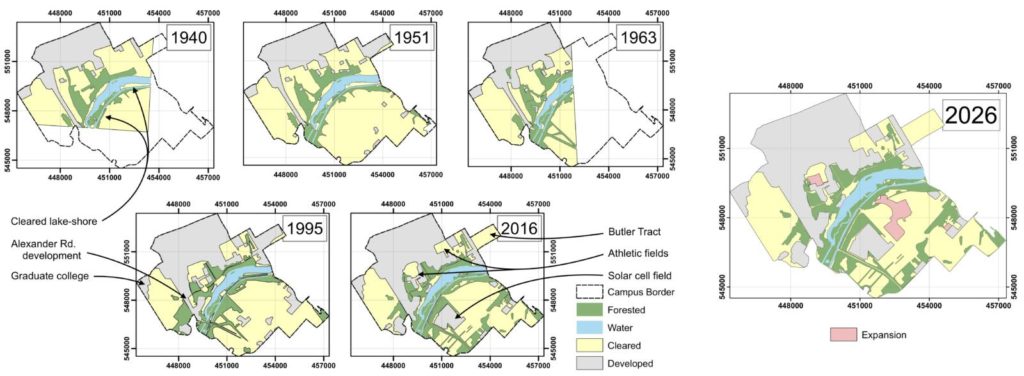
For each year of campus imagery, Benjy classified four different types of campus land cover: water, forested land, cleared land, and developed land. In ArcGIS, he used shapefiles to draw polygons around these areas. Shapefiles are a type of vector data used to represent categorical or non-continuous data. They commonly take the form of points, lines, or polygons. Roads, political boundaries, and land cover classifications are examples of common shapefiles.

Spatial Analysis: Area and Percent Change
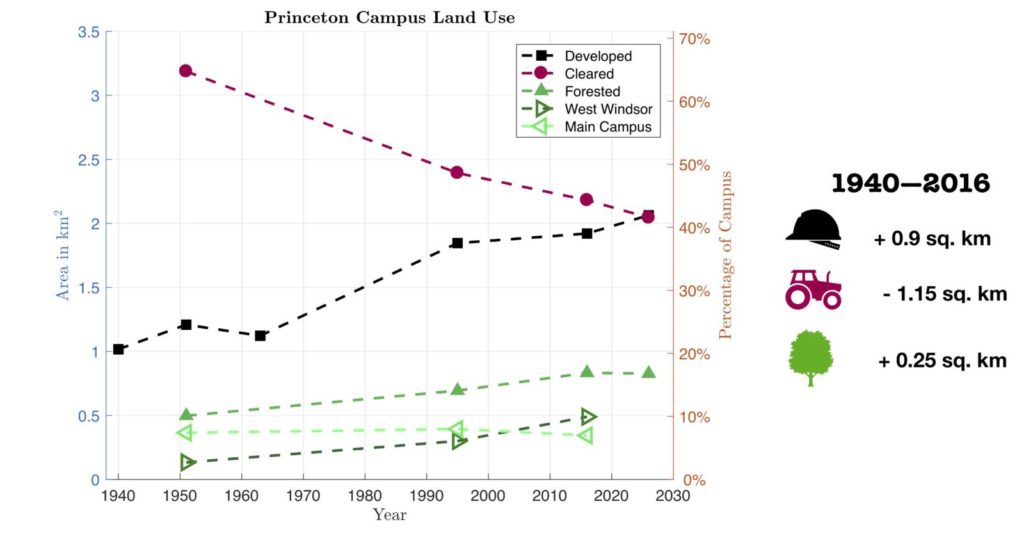
From the polygon shapefiles, Benjy calculated the percent area of each type of land cover within campus for every year of imagery. He then plotted a time-series showing how campus land cover has changed over the past 75+ years, and showed how the 2026 plan would add to that trend.

It turns out that Princeton’s recent land use history can be primarily summarized as developing previously cleared land. Large open spaces which once were farms have slowly been turned into dormitories, science labs, athletic facilities, and even solar cell fields, while forested tracts along lake Carnegie have been allowed to regrow. The planned 2026 development will continue this trend, building mainly on cleared land south of Poe Field and in West Windsor. However, these areas are directly adjacent to recovering forested areas which may be impacted or disturbed by the change in land use.
Large open spaces which once were farms have slowly been turned into dormitories, science labs, athletic facilities, and even solar cell fields, while forested tracts along lake Carnegie have been allowed to regrow.
Benjy’s project is just one example of the potential for GIS research. Geospatial analysis can be an extremely effective tool for visualizing and analyzing spatial data, and is relevant to many disciplines. As someone who loves maps and data visualization, I have really enjoyed learning how to use GIS software. Spatial analysis adds another dimension to research projects and lends itself to pretty sweet looking figures and graphics.
Luckily for you, Princeton offers many resources for getting started with GIS. Proprietary software such as ArcGIS is available through the University student license, while free open-source software such as QGIS is available online. If you are interested in learning how to use these applications, the university runs GIS training sessions throughout each semester and has online training courses available. There is even a dedicated GIS center in Lewis library!
–Alec Getraer, Natural Sciences Correspondent

