Data collection isn’t always the most exciting stage of a research project, but the payoff can make everything worth it. I’m currently deep into the data analysis portion of my thesis, running up against my draft deadline on March 1, and the dreaded Woodrow Wilson School deadline of April 3. I’m writing about asylum approval rates in the European Union and the United States for unaccompanied child migrants, or unaccompanied alien children (UAC) in the legal parlance. If the same law is applied across all regions, in theory, there should not be substantial variation in asylum grant rates — but the research literature and my preliminary findings demonstrate otherwise. Pulling together the data to calculate these preliminary findings, though, was much more difficult than I had anticipated — and I had to make a tough call about my data collection as I wrote up these findings.
Unaccompanied migrant children, as undocumented immigrants, are by their very nature hard to count or survey. There is no central data set on UACs, at least not one on the level of what exists for many other categories of immigrants. As a result, I had to build a data set for this myself, based off on the scraps of data I was able to track down.
One of my hypotheses posited that there would be variation between different United States Citizenship and Immigration Services (USCIS) offices. The previous research literature indicated that despite adhering to the same immigration law, different courts would have different results, perhaps due to the biases of individual judges or asylum officers. Using some of the skills that I’d learned through my journalism class (JRN 449: Migration Reporting) and as an opinion writer and editor for the Daily Princetonian, I tracked down quarterly disclosures of UAC asylum applications from USCIS. USCIS discloses UAC applications by geographic USCIS district (8 in total) and fiscal quarter of asylum hearing.
I found data going back to 2011. The problem, however, was that all of this data was published in PDF form, as well as online in tables on a data clearinghouse website. I could have asked the data clearinghouse to send me an Excel spreadsheet of this data, but they asked for a week and $265 to do so — time and money that I simply didn’t have this close to my thesis deadline. There was no getting around the inevitable — I had to copy and paste 6 years of data, subdivided into 4 quarters and 8 USCIS offices per quarter.
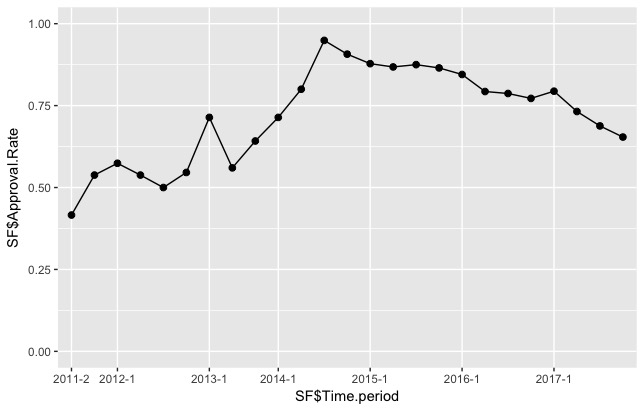
I really didn’t want to have to do that. But I wouldn’t be able to evaluate this research hypothesis otherwise, so I just spent a couple of days combing through all of these PDFs and copying and pasting the necessary data into my Excel spreadsheet. It wasn’t fun, but the results that I was able to pull from this data made everything worthwhile. I have some of my (very) preliminary results from this analysis below. The quarterly USCIS asylum approval rate is graphed on the y axis vs. time on the x axis for two cities: San Francisco and Arlington.
Based on some of my preliminary regression analysis, San Francisco and Arlington were both significant outliers from the mean United States asylum grant rate for unaccompanied child migrants. The two plots above show variation in these asylum grant rates over the period of time examined for my thesis. As you can see, asylum rates start to rise around the time of the Central American child migrant “surge” in mid-2014, and then start to decline afterwards – though the drop is significantly more pronounced in Arlington. I’m not sure, why, though, that the rate declined so precipitously in Arlington.
Despite my struggles with copying and pasting data, doing so gave me a quantitative dimension of analysis that I simply would not have had otherwise. So, when you hit a roadblock — don’t worry! Just keep on pushing forward, and everything will be okay. Consider all possible options, and then choose the direction that makes the most sense for the amount of time and resources you have to complete the project.
–Nicholas Wu, Social Science Correspondent


