In PSY/NEU 338, From Animal Learning to Changing People’s Minds, my group recently presented our capstone project for the course: we researched irrationality, trying to understand when humans make irrational decisions, how that is implemented in the brain, and if certain things might actually be incorrectly labeled as ‘irrational’. Our emotions are a leading example: although some call them irrational, in practice, they play a key role in fine-tuning our decision-making and reasoning abilities. When you’re happy, for example, everything might be going more positively than expected. Your mood is thus encouraging you to continue the behaviors that led to those rewards, since that positive trend might continue (for a neuroscientific discussion of this topic, see this paper).
To demonstrate this phenomenon first-hand, we had students in the class play what is known as the Ultimatum Game:
You are the proposer. You have been given $100. You are tasked with splitting your money with a stranger, the responder. If the responder accepts the split that you propose, you both keep the money after the game ends. If the responder does not accept, no one keeps the money.
The question: how much money do you decide to offer the responder?
After reading this, students had five seconds to provide their answer. They were then asked to report their mood. The question we wanted to answer was simple:
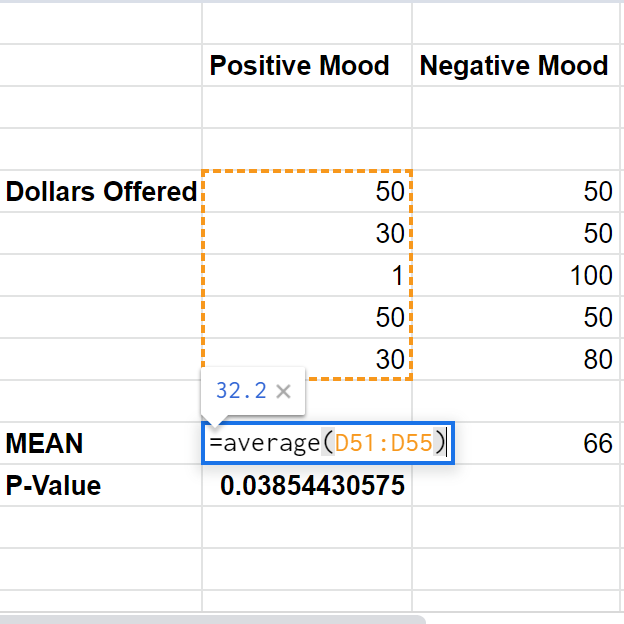
Is the amount of money people offered statistically different between those who reported “positive” versus “negative” moods?
In this post, I’ll explain some of the basic statistics I used to formally answer this question, bolding some key terms in the field along the way. In my next post, I’ll walk through the programming aspect for visualizing those statistics.