In PSY/NEU 338, From Animal Learning to Changing People’s Minds, my group recently presented our capstone project for the course: we researched irrationality, trying to understand when humans make irrational decisions, how that is implemented in the brain, and if certain things might actually be incorrectly labeled as ‘irrational’. Our emotions are a leading example: although some call them irrational, in practice, they play a key role in fine-tuning our decision-making and reasoning abilities. When you’re happy, for example, everything might be going more positively than expected. Your mood is thus encouraging you to continue the behaviors that led to those rewards, since that positive trend might continue (for a neuroscientific discussion of this topic, see this paper).
To demonstrate this phenomenon first-hand, we had students in the class play what is known as the Ultimatum Game:
You are the proposer. You have been given $100. You are tasked with splitting your money with a stranger, the responder. If the responder accepts the split that you propose, you both keep the money after the game ends. If the responder does not accept, no one keeps the money.
The question: how much money do you decide to offer the responder?
After reading this, students had five seconds to provide their answer. They were then asked to report their mood. The question we wanted to answer was simple:
Is the amount of money people offered statistically different between those who reported “positive” versus “negative” moods?
In this post, I’ll explain some of the basic statistics I used to formally answer this question, bolding some key terms in the field along the way. In my next post, I’ll walk through the programming aspect for visualizing those statistics.
My first step was figuring out the exact question I wanted to answer. After I came up with the idea to compare responses in the Ultimatum Game for people with different moods, I reflected on the source of the data I would need to collect. My sample would comprise of responses from my classmates, meant to represent data from a population: this could be the entire student body of Princeton, or even the entire US. In a robust study, the sample would be representative of the population it is drawn from, like with respect to demographics.
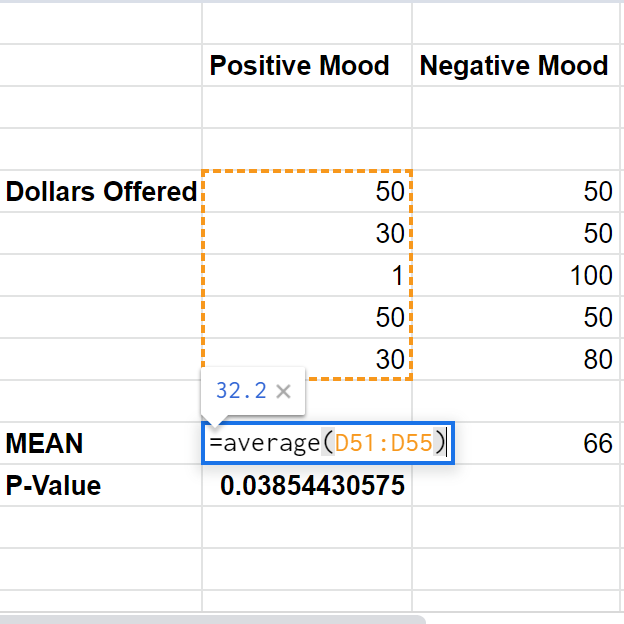
Before trying to compute anything fancy with the data, I worked out the statistics behind determining if the amount of money offered to the responder is different for the two categories of positive and negative moods. The process for answering this question can seem a bit counterintuitive: the first step is to speculate that there is no difference between the mean amount of money offered to the responder in the positive and negative mood groups. After making this assumption, I was able to move forward with calculating the probability of getting means at least as different as the ones I see in the data. In other words, if these means are actually the same at the population level (that’s the assumption we made), what is the chance they just happen to look as different as they do ($32.2 and $66 look very different, but are they?) in our sample because of random chance? This probability is called the p-value. If that probability is very low – conventionally below a significance threshold of 5% – we can reject that assumption we made earlier that the categories aren’t different (this is called rejecting the null hypothesis), since the means are very likely to be different in that case. If that probability is higher than our threshold, we fail to reject the null hypothesis, since there’s a relatively large possibility that the true means are equal and they appear as different as they do because of random chance alone.
A t-test describes the process of assuming the null hypothesis to be true and computing the p-value we just discussed. While t-tests are widely available in various software, I opted for Google Spreadsheet’s built in methods. In the image below, D51:D55 were the cells of data corresponding to the positive mood group, whereas E51:E55 belonged to the negative mood group. The next parameters, however, are contingent on the specific data and question being asked. The first ‘2’ has to do with the nature of the question: I personally didn’t want to test if the positive group offered more or less money to the negative group, I only wanted to know if they were different. The ‘2’ stands for two-tailed, meaning the function tests the possibility of positive and negative differences, whereas a ‘1’ would only test for a positive or negative difference. More specifically, it would be easier to detect a positive difference if that’s exclusively what I was looking for, but the cost is that the test ignores the possibility of a negative difference altogether. The second ‘2’ has to do with the data: since the values in one sample of data don’t depend on the values in the other sample (i.e, they are statistically independent), I opted for a two-sample t-test, rather than a paired t-test. Of course, these parameters could easily be different in different programs, so be aware of that if you’re implementing this for yourself!
The software returns a p-value of 0.0385, which is below the conventional threshold of 0.05 mentioned earlier. That means that the probability of observing sample means at least as different as ours between the two groups assuming the population means are the same is actually quite small: we’ll reject the null hypothesis and conclude that they are statistically significantly different. People in the positive mood category did offer the responder a different quantity of money than people in the negative mood category! To be clear, however, I’m not quite sure why that might be the case: my goal was simply to get at the idea that our moods may play a role in our decision making! Given that the Ultimatum Game is a common paradigm in much economics research, accounting for mood could be important for accurately making sense of data.

A lot of the time, actually computing the p-value is the easy part: thinking about a research question and collecting the data come before that. Even then, having a p-value is only half the battle: visualizing the data gives a clearer picture and is critical for fully interpreting results. Clarifying sample sizes (which are small in this example dataset) is also important. I hope this post encourages some of you to use some statistics in your courses even when it isn’t asked of you and that I was able to clarify some concepts. Keep an eye out for my next post on visualizing this same dataset!
–Kamron Soldozy, Natural Sciences Correspondent
