Matplotlib: A Quick Intro to a Helpful Python Data Visualization Library

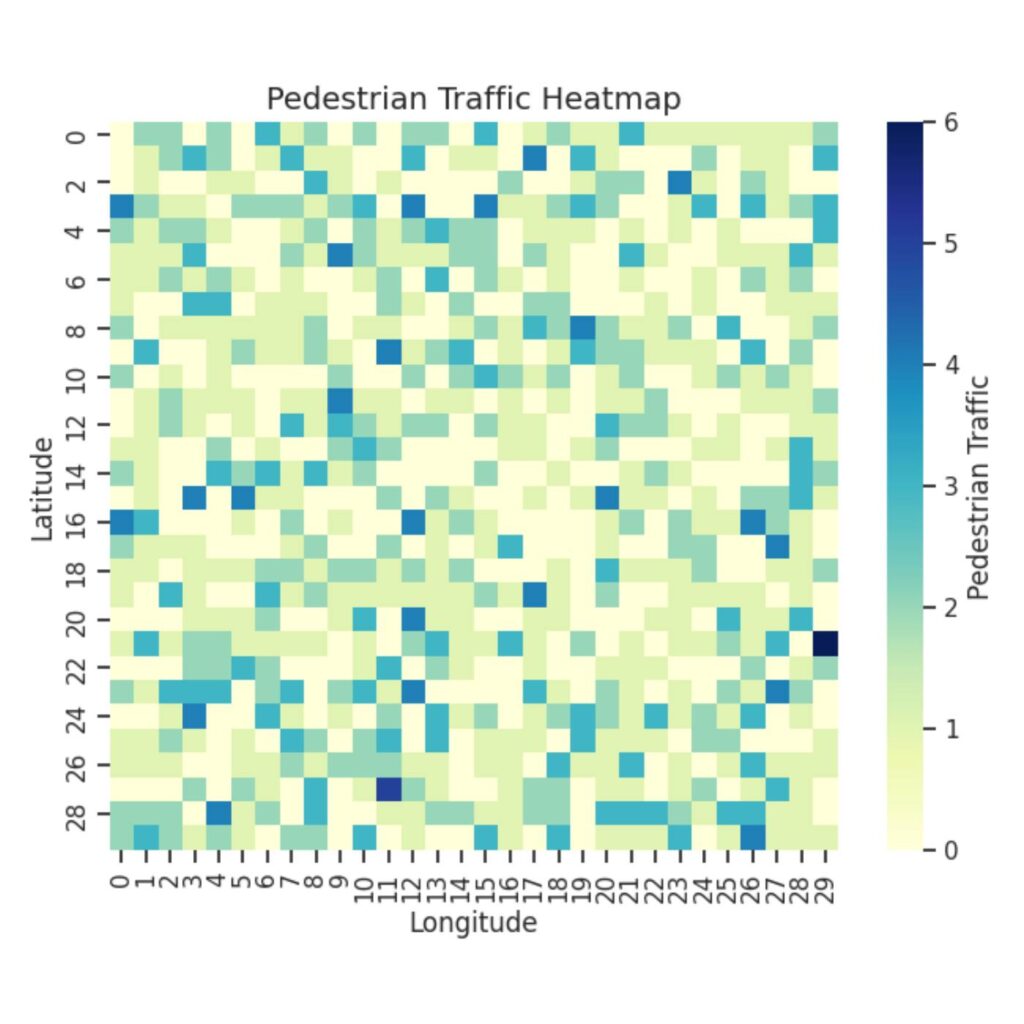
Graph of a heatmap with colors ranging from pale green to dark blue to indicate density of pedestrians.
Example heatmap of pedestrian traffic generated by the author to illustrate some of Matplotlib’s capabilities.

Data is everywhere. Whether it’s to track your music listening habits, analyze stock market trends, or understand scientific research, data is most valuable when it can be easily interpreted. This is where data visualization comes in: to transform raw data into clear, engaging visuals.

The Princeton University Library has a wealth of resources and research guides, including guides tailored specifically to data visualization in programming language R and statistical software Stata (often used in economics courses). However, not as many PUL research guides are currently available on data visualization in Python. If you haven’t heard of Python before, it’s a popular programming language that can tackle a versatile range of applications, including data analysis and artificial intelligence. While Stata and R are both excellent choices for statistical analysis and visualization, Python stands out for its flexibility, interactivity, and seamless integration with web development and machine learning applications.

In this article, I wanted to present a commonly-used Python library for data visualization: Matplotlib. By learning how to use Matplotlib, you’ll be able to take your data and turn it into visuals that communicate your findings effectively—a key skill whether you are analyzing survey results, studying statistics, or working on research projects!

Continue reading Matplotlib: A Quick Intro to a Helpful Python Data Visualization Library

Bridging Research and Political Change

Spotlight on the Summer Internship Project of Princeton Politics Junior Mai Kasemsawade

Mai standing in front of a stage in the Malaysian parliament.
Mai Kasemsawade at the All-Party Parliamentary Group Malaysia for Political Financing meeting at the Malaysian Parliament, which she helped to host with The Institute for Democracy and Economic Affairs.

Many students walk into Princeton intending to change the world, Mai Kasemsawade ’26 is an extraordinary example of how one’s summer research can kickstart global political change. This past summer, Mai worked within the The Institute for Democracy and Economic Affairs in Kuala Lumpur, Malaysia as an intern in the Princeton International Internship Program. She connected her interests in political science research and data science to pursue an ambitious project in advancing Malaysia’s laws on funding for political parties in order to encourage a more democratic political scene. Her experience meeting with Malaysian government leaders, hosting a political engagement workshop, writing articles on critical policy, and conducting interdisciplinary research exemplifies the multitude of eye-opening opportunities that a research experience can offer!

Continue reading Bridging Research and Political Change