For this post in our collaboration with Princeton Perspectives Project I dusted off my blog-writing skills and had the pleasure of interviewing 2nd year EEB PhD student Kelly Finke. She uses computational biology techniques to study collective human behavior in Professor Corina Tarnita’s lab.
Continue reading An Interview with Kelly Finke on Finding your Way in Research and the Meaning of FailureIntroducing the Sophomore Research Seminars: An Interview with Professor Emma Ljung
With course selection coming around the corner, the sheer number of opportunities can be overwhelming. Choosing courses can be doubly challenging for rising sophomores who are finishing up their prerequisite courses and trying to figure out what they even want to major in. I wanted to take this opportunity to introduce a new and exciting opportunity for students interested in research—the Sophomore Research Seminars.
Continue reading Introducing the Sophomore Research Seminars: An Interview with Professor Emma LjungResearch During the Academic Year: Tips for Time Management & Pursuing your Passions

Whether you’re trying to free up your summer to enjoy one of Princeton’s other fully-funded programs, or maybe pave the way for more advanced summer or independent research opportunities, it’s understandable why you might want to get a head start on research during the academic year. But, with jam-packed class schedules, multiple labs, essays to write, and hopefully squeezing in some time for yourself, it can feel impossible to do research on top of life at Princeton. So, how do students do it? Can you really spend 8-10 hours per week on research and still find work-life balance? In short, it depends. The number of classes you’re taking, extracurriculars, and your own unique circumstances all factor into whether research during the academic year is sustainable for your class schedule. For some, research can be a valuable addition to their academic schedules. But, like anything at Princeton, it requires careful planning, time management, and clarifying your own values. Here are three tips for striking balance with research during the academic year.
Continue reading Research During the Academic Year: Tips for Time Management & Pursuing your PassionsMy Favorite Introductory Lab at Princeton
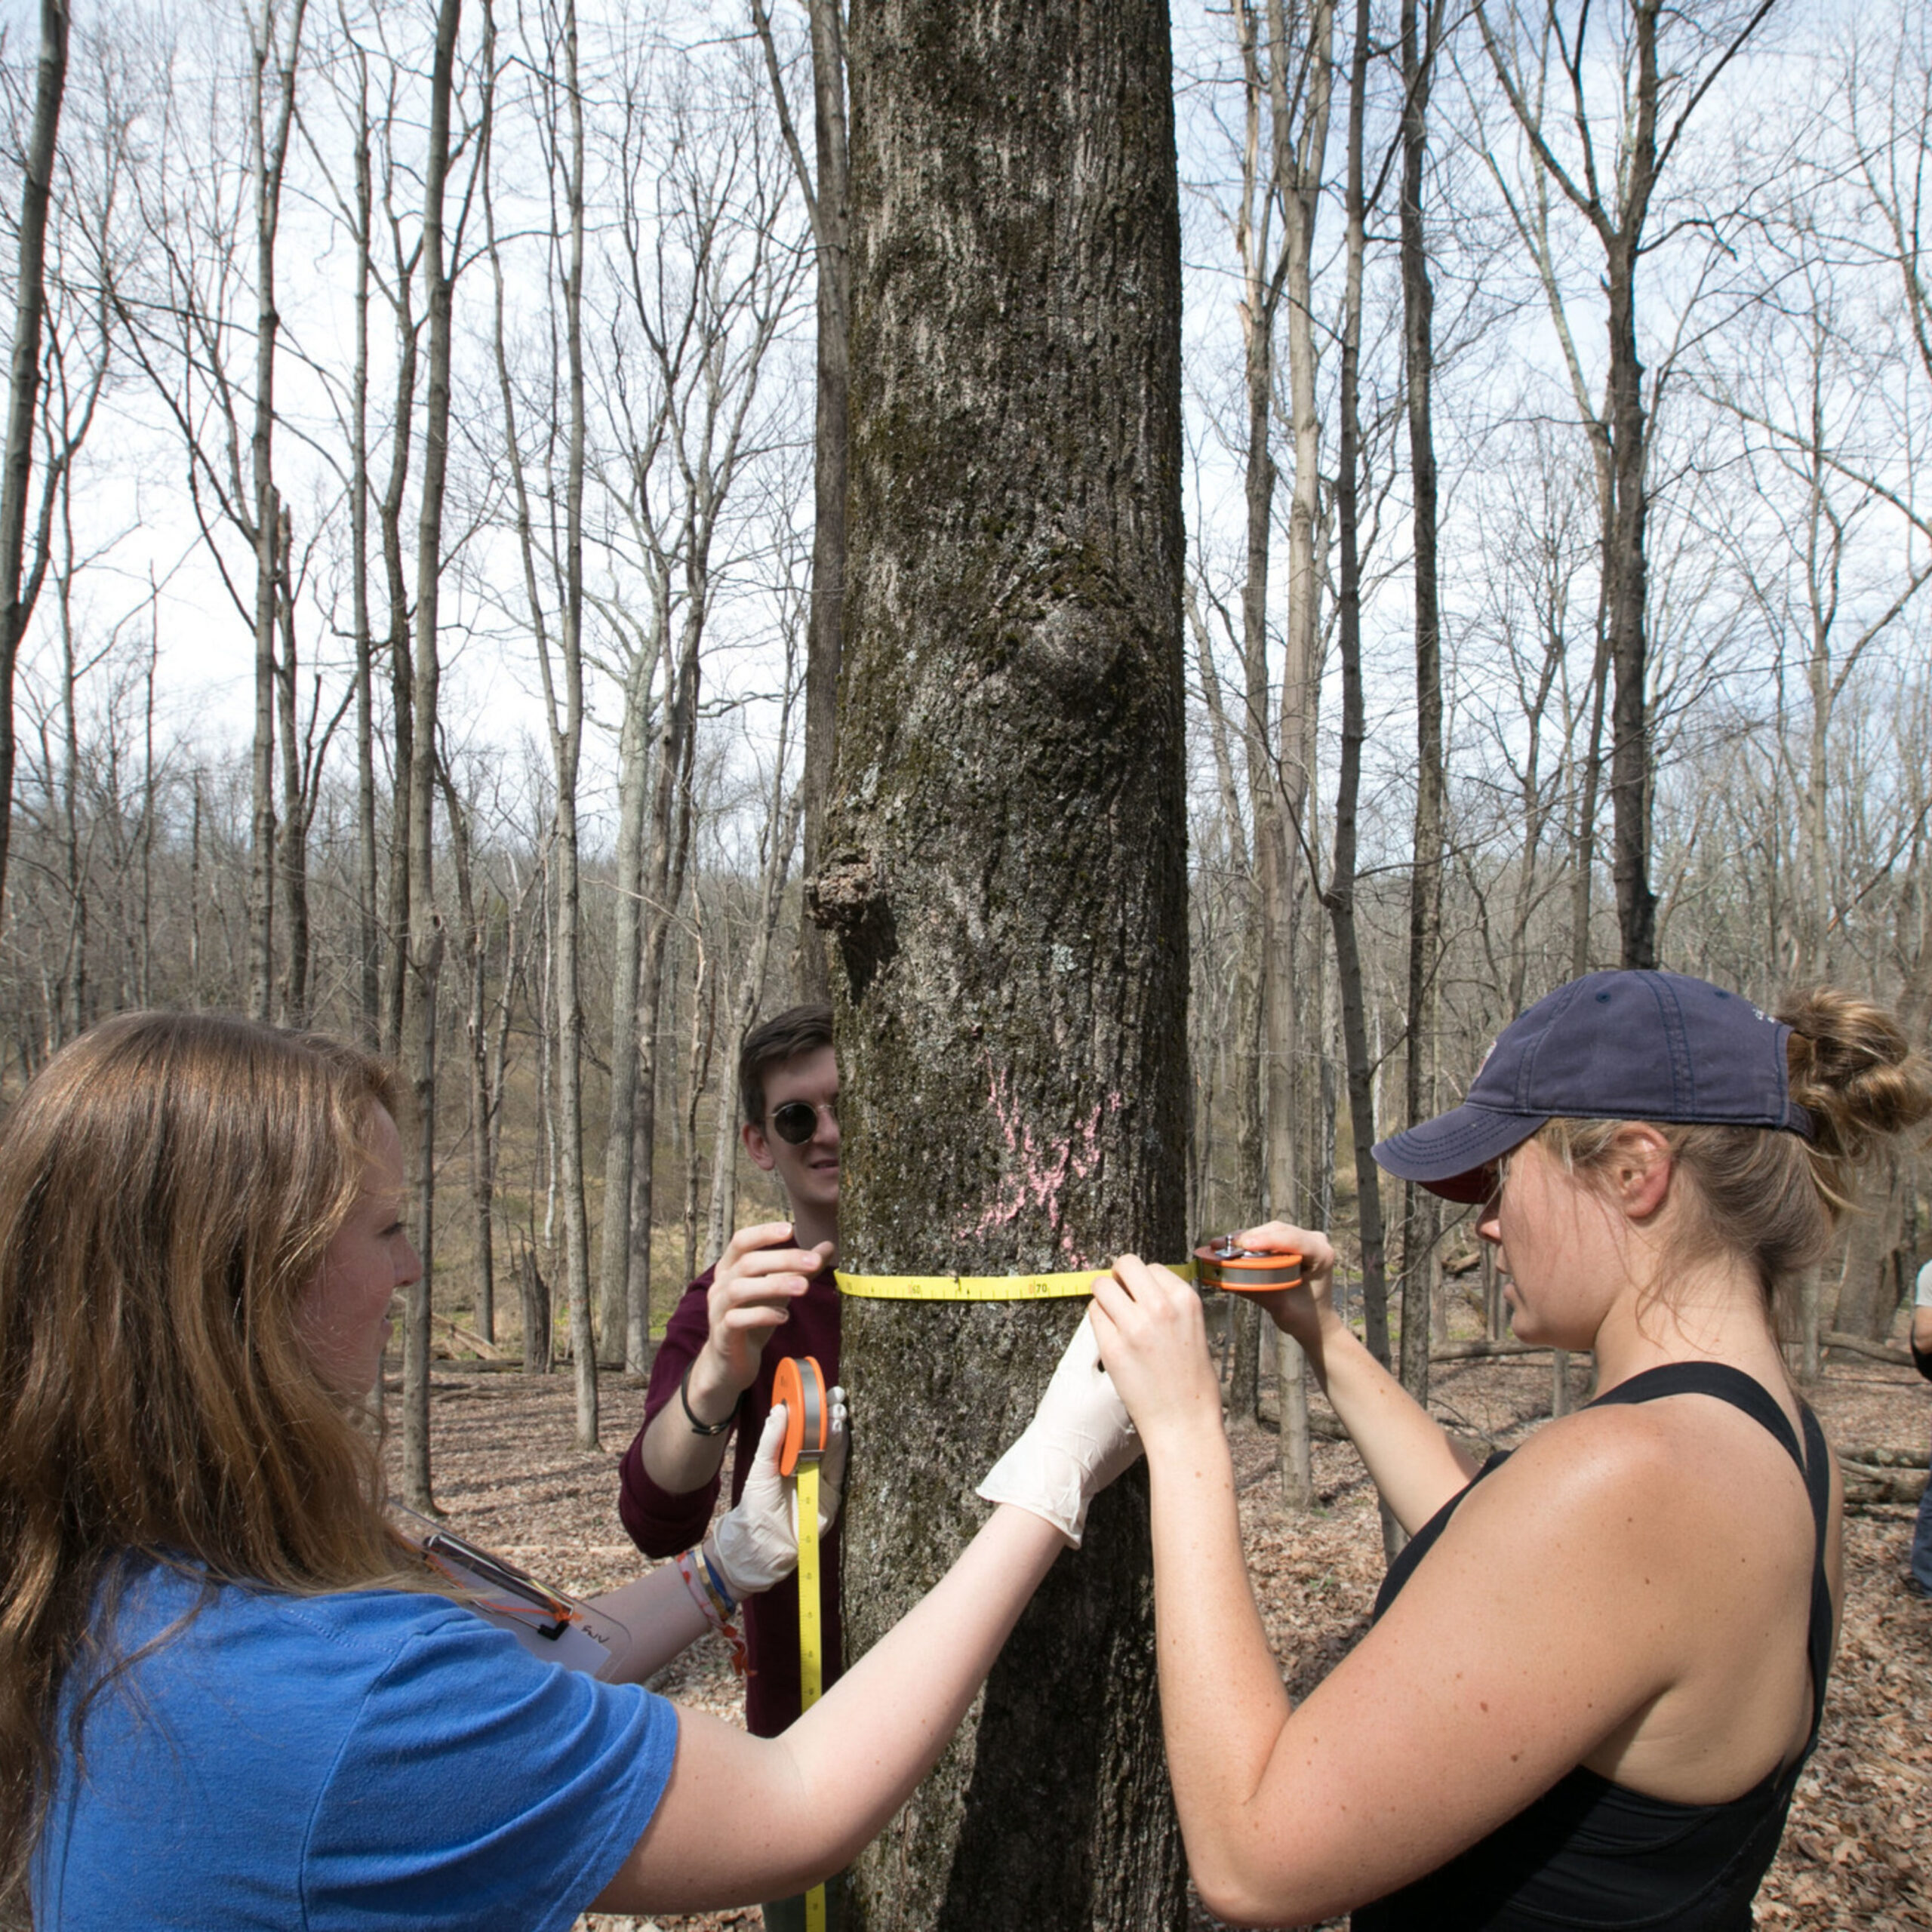
I had lab from 7:30pm to 10:20pm and it was one of my favorite Princeton memories. I tend to get weird looks when I say that, but it’s true! I took EEB 211 fall of my freshman year, mostly because I thought the name “Life on Earth: Mechanisms of Change in Nature” sounded cool. The course itself is the introductory course to Ecology and Evolutionary Biology, and it is similar to some of what I learned in AP Biology in high school but with much more of a focus on species-wide interactions. Format wise, it is a pretty classic lecture Biology class with only a midterm and final, and while the lectures were super interesting the real fun is the labs.
Continue reading My Favorite Introductory Lab at PrincetonThe Creation of TigerResearch: An Interview with Vivek Kolli ’24
Vivek Kolli ’24 is Vice Chair of the Julis-Rabinowitz Center for Public Policy and Director of Marketing and Outreach for Scholars of Finance.
A few weeks ago, I interviewed Vivek Kolli ‘24, a junior in the Operations Research and Financial Engineering (ORFE) department. Vivek is one of the three developers for TigerResearch, a comprehensive platform that allows for students to easily navigate through their database of Princeton professors and their research areas. In our interview*, we discuss his vision for the platform, the importance of entrepreneurial ideas in driving the research process, and advice for students who would like to get involved with research at Princeton.
Continue reading The Creation of TigerResearch: An Interview with Vivek Kolli ’24Missed the First ReMatch Dinners? I Got You Covered
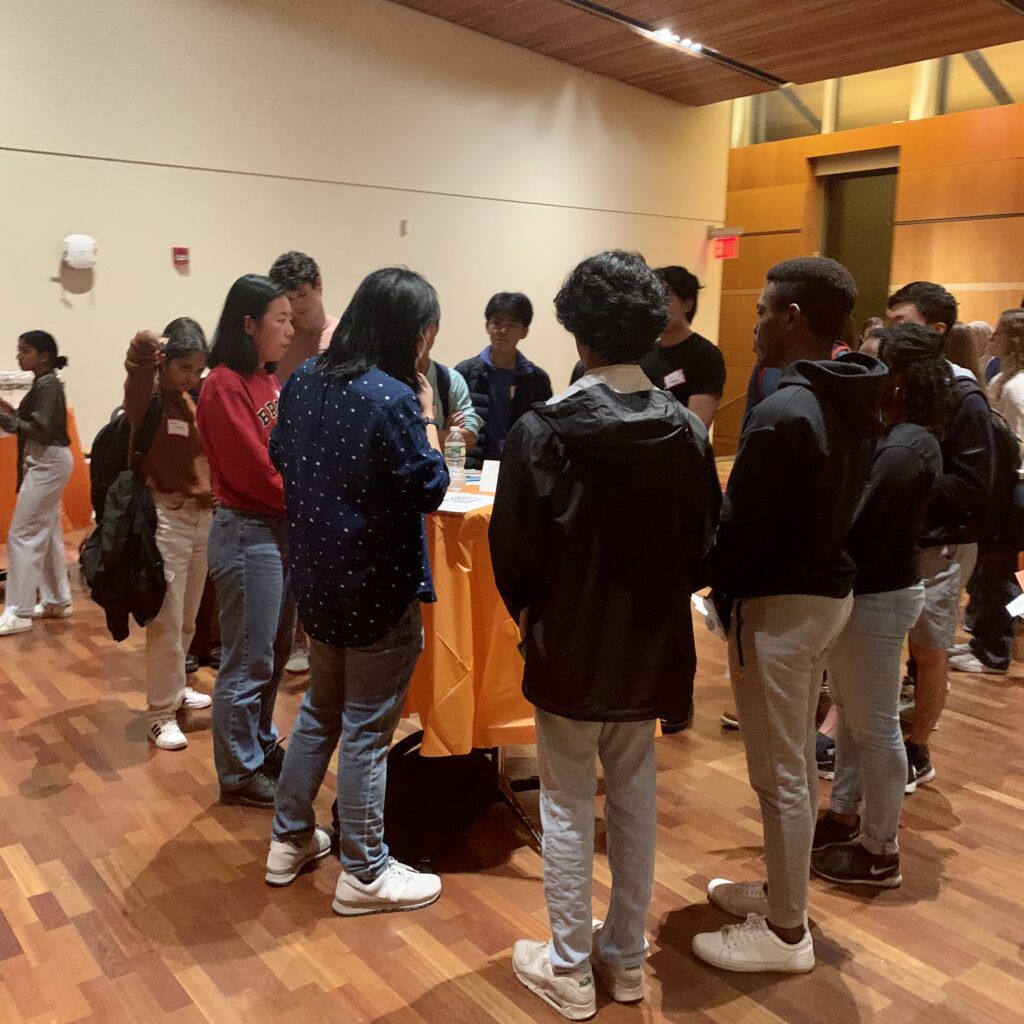
Princeton gives its farthest walks to its strongest academic weapons. Still, sometimes schlepping all the way to the Carl A. Fields (CAF) Center is just a bit too much. If you felt like this around 6:00pm on Tuesday October 4th or Thursday, October 13th, you just may have missed the first ReMatch dinner. No worries! I am here to fill you in on what you missed and hopefully convince you that the next one is worth the walk. First things first, ReMatch (developed and led by the Office of Undergraduate Research and the Graduate School) is a program that helps match first- and second-year undergraduates interested in research with graduate student and postdoc researcher mentors. Mentor and mentee pairs that develop potentially embark on a summer of research in Princeton fully funded by the university. At the dinners, students can eat catered food, mingle, and chat with researchers at tables.
Continue reading Missed the First ReMatch Dinners? I Got You CoveredA Budding Field: Finding Opportunities in Psychedelic Research

One goal for any budding researcher is to see their work have a tangible public impact. But, with endless hours spent in a lab or hunched over a computer, there are times where research can feel abstract or removed from reality. Neuroscience, in particular, faces this stereotype. True, many (including myself) believe that neuroscience holds the key to understanding our conscience and, by extension, our modern predicament. But the question remains: where can an aspiring neuroscientist find the life-altering research they seek?
Ironically, the answer might just lie in reality-altering substances. From neuroscience to public policy, psychedelics is a budding topic across many different fields of research. While Princeton itself is yet to enter the field, the Princeton Science of Psychedelics Club (PSPC) serves as the hub for all students interested in this emerging field. I sat down with PSPC and senior Neuroscience Major President Camilla Strauss to talk about how students interested in psychedelics research could learn more.
Continue reading A Budding Field: Finding Opportunities in Psychedelic ResearchNo Experience, No Problem! A Guide to Being the Newest in the Lab
Having no knowledge about Neuroscience at the time, I did not expect my experience taking Advanced Placement Psychology to amount to more than an interesting elective. However, I discovered my passion for research through Dr. Volpicelli-Daley, who came to our class to give a presentation about her research on Parkinson’s Disease with mouse models. She invited us to apply for a position as a research assistant in her lab, and I ended up getting the job. I worked with the Volpicelli-Daley research team at the University of Alabama at Birmingham during the summer between my junior and senior years of high school and then again over my gap year before coming to Princeton.
Continue reading No Experience, No Problem! A Guide to Being the Newest in the LabDear First Time Coders, You Can Do It
“I can’t code,” I told my friends when I realized that I had to take a statistics course for my major that required coding. “I don’t understand it,” I told them. I had never coded before and the thought of creating algorithms on a computer sent shivers down my SPIA spine. I loved math in high school, and coding always seemed interesting to me, but rumors about Princeton math courses, as well as computer science courses, had me sprinting away from Fine Hall. But then, I realized I had to take a statistics course for SPIA. I had to face my fear of R, or the programming language that most SPIA statistics courses use for statistical computation. I didn’t think that I could do it, but I did. And, I ended up loving it. I faced my fears, learned how to code, and you can too.
Continue reading Dear First Time Coders, You Can Do ItVisualizing COVID-19 Mutations Using PyMOL, a University Provided Resource
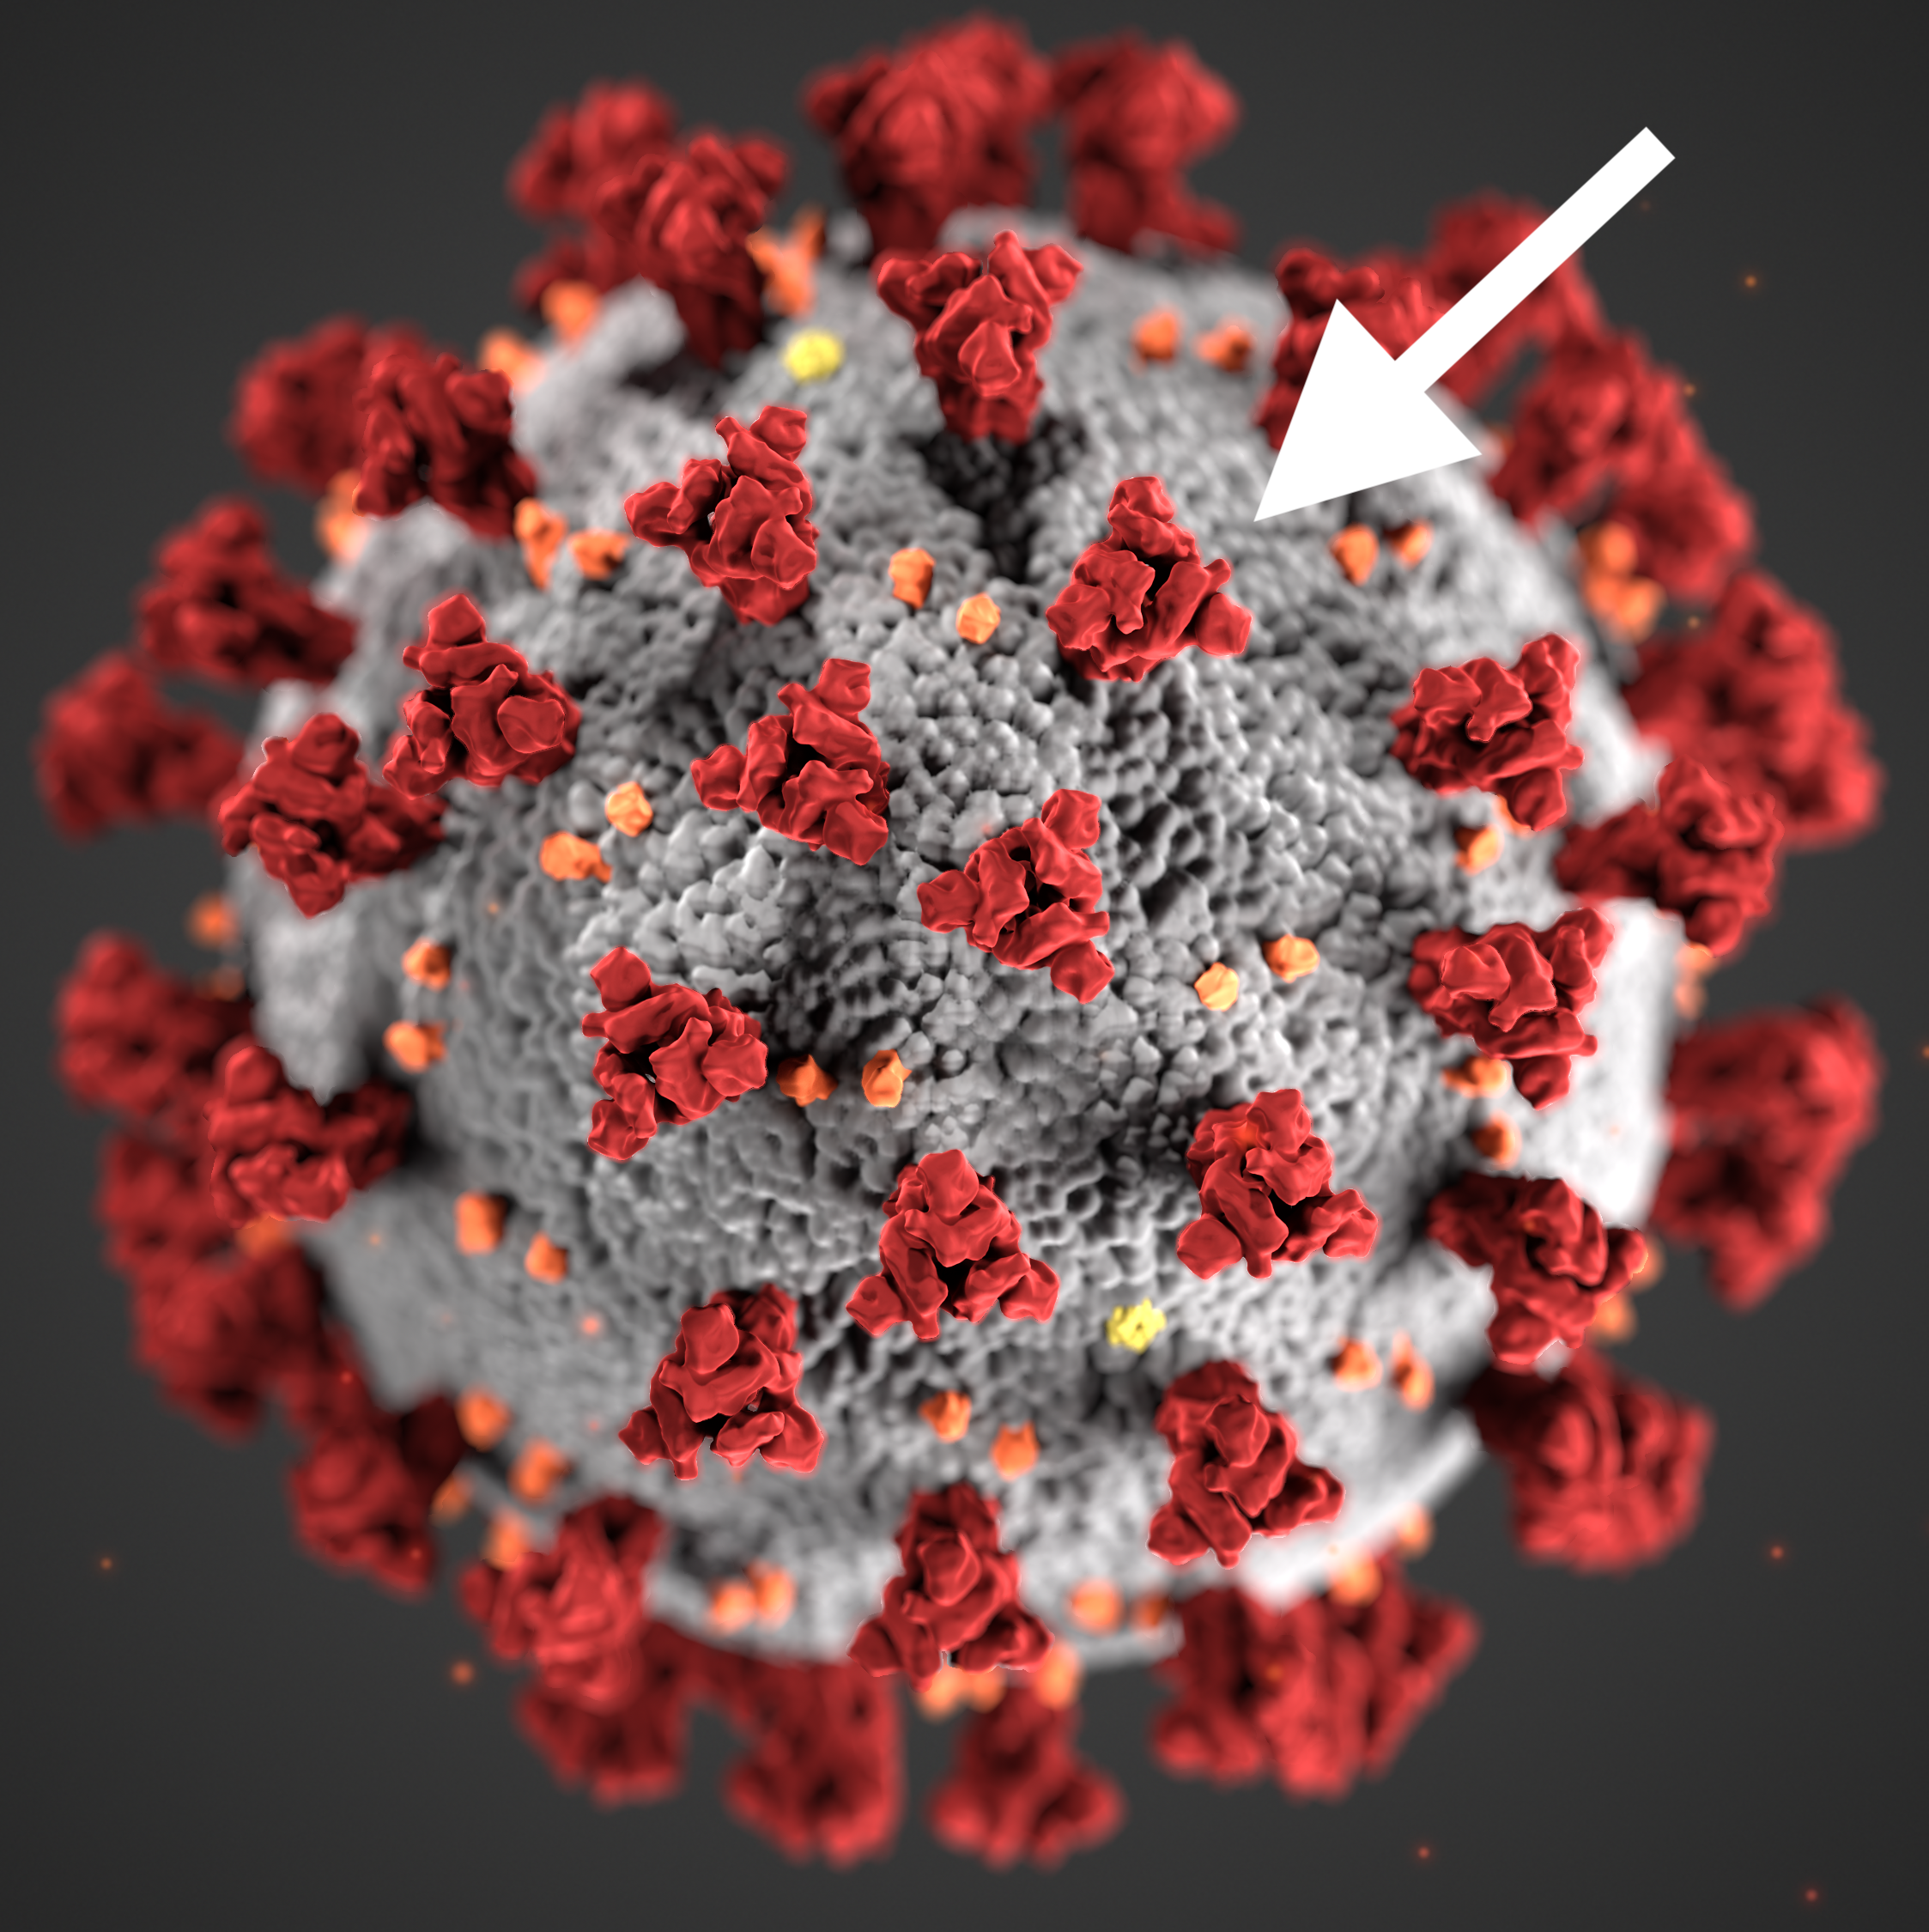
These days, it seems like every day we learn of a new variant of SARS-CoV-2 (the virus that causes COVID-19). However, it’s hard to understand what a variant is and how it changes the virus. In this post, I wanted to introduce PyMOL, a program that students have access to through the University. This program can be used to see what the spike protein and its mutations actually look like.
But first, here’s some background on SARS-CoV-2: COVID-19 is a disease caused by a strain of coronavirus called SARS-CoV-2. This virus gets inside the human cells by using something called a spike protein. This spike protein binds to a receptor on the human cell called the ACE2 receptor, and this allows the virus to infiltrate the cell. The variants of SARS-CoV-2 that we keep hearing about typically have different mutations on the spike protein. In the case of the B.1.1.7 variant, which is a variant that is thought to be 30-50 percent more infectious than other variants in circulation, the mutations are at a location that allow the spike protein to bind better to the ACE2 receptor. If you bind better to the receptor, you’re better at infiltrating the cell. The spike is also the target of the vaccine and our natural immune system.
Now, let’s try and look at where these mutations actually are.
