Journeying through Statistics & Machine Learning Research: An Interview with Jake Snell

Image of Dr. Snell smiling, wearing glasses and a pale red and grey checkered collared shirt.

Jake Snell is a DataX postdoctoral researcher in the Department of Computer Science at Princeton University, where he develops novel deep learning algorithms by drawing insights from probabilistic models. He is currently serving as a lecturer for SML 310: Research Projects in Data Science.

As I dive deeper into my computer science coursework, I’ve found myself engaging increasingly with statistics and machine learning (hereafter abbreviated as SML). Opportunities to conduct SML research are abound at Princeton: senior theses, junior independent work, research-based courses such as SML 310: Research Projects in Data Science, joining research labs, and much more. There is such a wide variety of research opportunities, and so many nuanced pathways that students can take while exploring SML research. So, for this seasonal series, I wanted to speak with professors and researchers who are more advanced in their research journeys to share their insight and advice to undergraduate students.

Continue reading Journeying through Statistics & Machine Learning Research: An Interview with Jake Snell

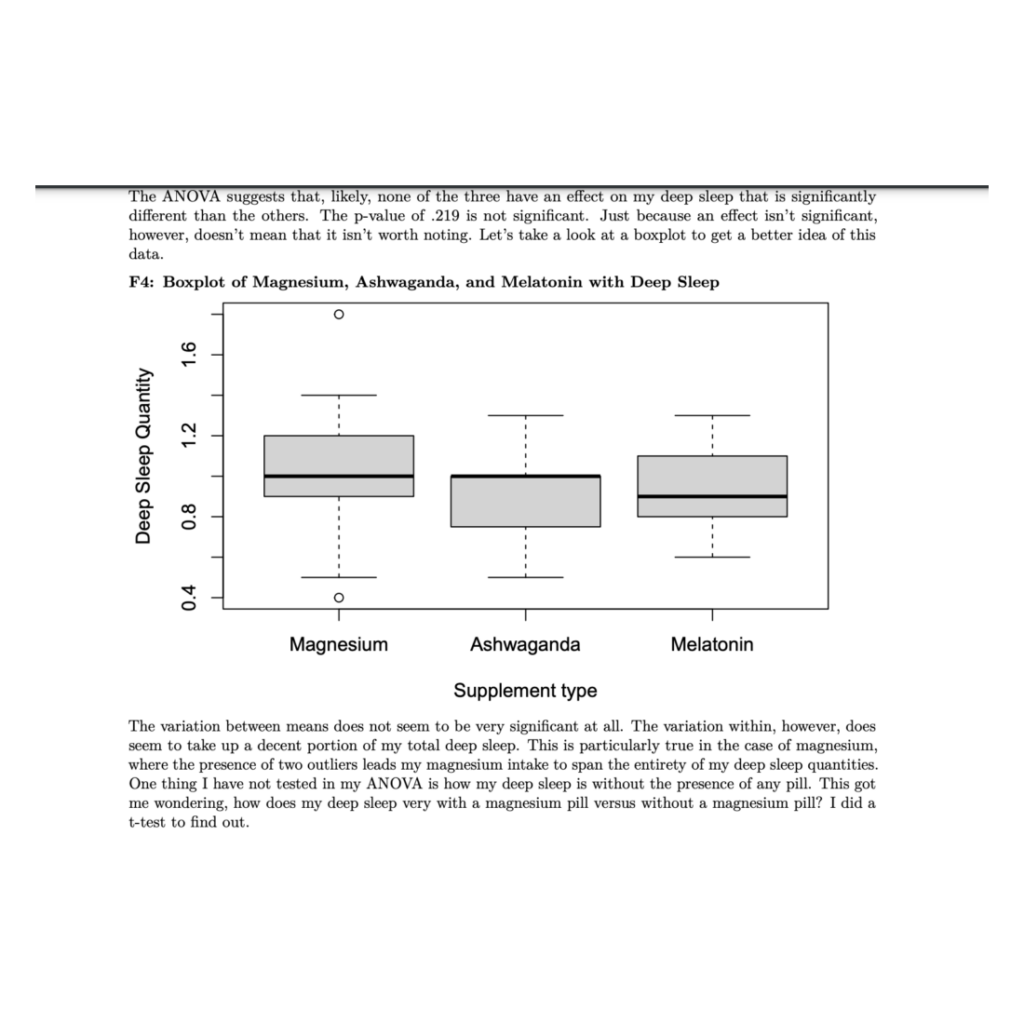
A Figure Speaks a Thousand Words

Example boxplot titled Boxplot of Magnesium, Ashwaganda, and Melatonin with Deep Sleep. The boxplot analysis indicates statistically insignificant variations among supplement types. The author describes the follow-up question after their ANOVA analysis: how does my sleep vary with a magnesium pill vs. without a magnesium pill?
The boxplot comparison accurately reflects the variation between different sleep supplements and their effect on deep sleep quantity. As seen above, the boxplot demonstrates the presence of a single outlier under the Magnesium group which could have easily skewed and misrepresented the data in another type of figure.

As anyone who has taken one of Princeton’s introductory statistics courses can tell you: informative statistics and figures can and will be incredibly useful in supporting your research. Whether you’re reworking your R1, writing your first JP, or in the final stages of your Senior Thesis, chances are you’ve integrated some useful statistics into your argument. When there are a million different positions that one can take in an argument, statistics appear to be our research’s objective grounding. The data says so, therefore I must be right. Right?

Continue reading A Figure Speaks a Thousand Words

Dear First Time Coders, You Can Do It

As a SPIA major, I was worried about coding for the first time. But, after taking POL345, I realized that I actually love statistics and computer science.

      “I can’t code,” I told my friends when I realized that I had to take a statistics course for my major that required coding. “I don’t understand it,” I told them. I had never coded before and the thought of creating algorithms on a computer sent shivers down my SPIA spine. I loved math in high school, and coding always seemed interesting to me, but rumors about Princeton math courses, as well as computer science courses, had me sprinting away from Fine Hall. But then, I realized I had to take a statistics course for SPIA. I had to face my fear of R, or the programming language that most SPIA statistics courses use for statistical computation. I didn’t think that I could do it, but I did. And, I ended up loving it. I faced my fears, learned how to code, and you can too.

Continue reading Dear First Time Coders, You Can Do It

Essential Packages for Advanced Statistical Analysis in R – A Primer

Students who are interested in research – especially junior- and senior-year students preparing for independent work – are often encouraged to master the use of a fully-featured statistical software like Stata or R in order to help with their statistical analysis. For example, in the Economics program at Princeton, Stata is often the software of choice for classes like ECO 202 (Statistics and Data Analysis for Economics) or ECO 302/312 (Econometrics). Similarly, other departments (for example, for the Undergraduate Certificate Program in Statistics and Machine Learning) offer SML 201 (Introduction to Data Science) or ORF 245 (Fundamentals of Engineering Statistics) to prepare students in the use of R. Usually, students end up developing a preference for one or the other even if they eventually grow proficient in both. While our coursework (rightly!) emphasizes the statistical methods, we, as students, are often left to navigate the intricacies of the statistical tools on our own. This post is a primer of some of the core packages in R that are used for advanced statistical analysis. As you begin to search for tools in R that can help you with your analysis, I hope you will find this information useful.

Continue reading Essential Packages for Advanced Statistical Analysis in R – A Primer

A Quick Crash Course in Statistics: Part 2

Most people’s New Years Resolutions, I imagine, are not about improving their knowledge of statistics. But I would argue that a little bit of knowledge about statistics is both useful and interesting. As it turns out, our brains are constantly doing statistics – in reality, our conscious selves are the only ones out of the loop! Learning and using statistics can help with interpreting data, making formal conclusions about data, and understanding the limitations and qualifications of those conclusions.

In my last post, I explained a project in my PSY/NEU 338 course that lent itself well to statistical analysis. I walked through the process of collecting the data, using a Google Spreadsheet for computing statistics, and making sense of what a ‘p-value’ is. In this post, however, I walk through how I went about visualizing these results. Interpretation of data is often not complete before getting a chance to see it. Plus, images are much more conducive than a wall of text when it comes to sharing results with other people.

Continue reading A Quick Crash Course in Statistics: Part 2