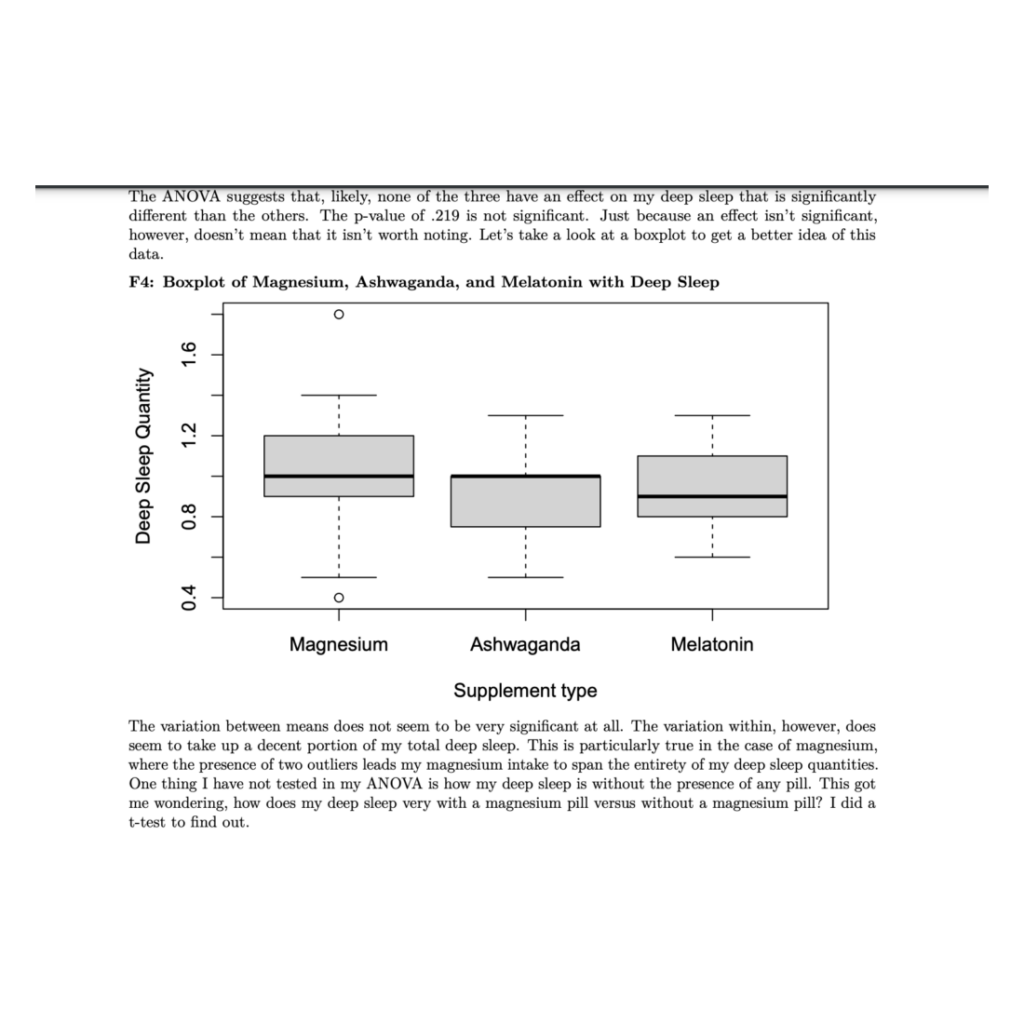
As anyone who has taken one of Princeton’s introductory statistics courses can tell you: informative statistics and figures can and will be incredibly useful in supporting your research. Whether you’re reworking your R1, writing your first JP, or in the final stages of your Senior Thesis, chances are you’ve integrated some useful statistics into your argument. When there are a million different positions that one can take in an argument, statistics appear to be our research’s objective grounding. The data says so, therefore I must be right. Right?
Continue reading A Figure Speaks a Thousand Words

