Over the last few weeks of the semester, I needed to make two posters. In preparation, I attended a poster workshop that made me think more intentionally about how to make an effective poster. I’ve outlined some of my key takeaways below that I hope can offer guidance to anyone preparing a poster of their own.
Rishika at the American Physical Society Division of Plasma Physics 2025 Conference. Funding acknowledgement: Received a student travel grant and outstanding student presenter award from the American Physical Society. Picture taken by Rishika Porandla.
At Princeton, research does not always look the way people imagine. It is not always telescopes pointed toward the sky or chalkboards filled with equations. Sometimes, it happens in quiet laboratories where the goal is to understand things you cannot even see, like streams of charged particles moving through space.
For Rishika Porandla, a member of the Class of 2028 majoring in astrophysics, this is exactly where her work lives. Her research sits at the intersection of space, plasma, and the instruments that allow scientists to study both.
When Erika Yeung arrived at Princeton, she knew she was drawn to the intersection of hardware and intelligence, the idea that physical systems like chips and sensors could not only compute, meaning process information, but also perceive the world, learn from data, and adapt over time. As a sophomore in the Electrical and Computer Engineering department, she took a bold step into that space through independent research with Professor Hossein Valavi. Her work focused on how neural networks, which are computer models inspired by the way the human brain processes information, can be redesigned to run efficiently on edge devices. These are small, local devices such as phones, sensors, or embedded systems that operate without relying on distant cloud servers.
At the heart of Erika’s work was quantization, a technique that reduces the numerical precision of neural network weights, which are the internal values that determine how the model makes decisions. Instead of using highly precise numbers, quantization simplifies them into smaller, more compact representations. This allows the model to take up less memory and run faster while still maintaining strong performance. This idea is central to fields like Edge AI and TinyML, which aim to move machine learning out of large data centers and into everyday devices, from wearable health monitors to autonomous systems operating far from the cloud. Running AI locally means the models must be not only accurate, but also lightweight, fast, and energy efficient. Quantization offers one of the most promising ways to make that possible.
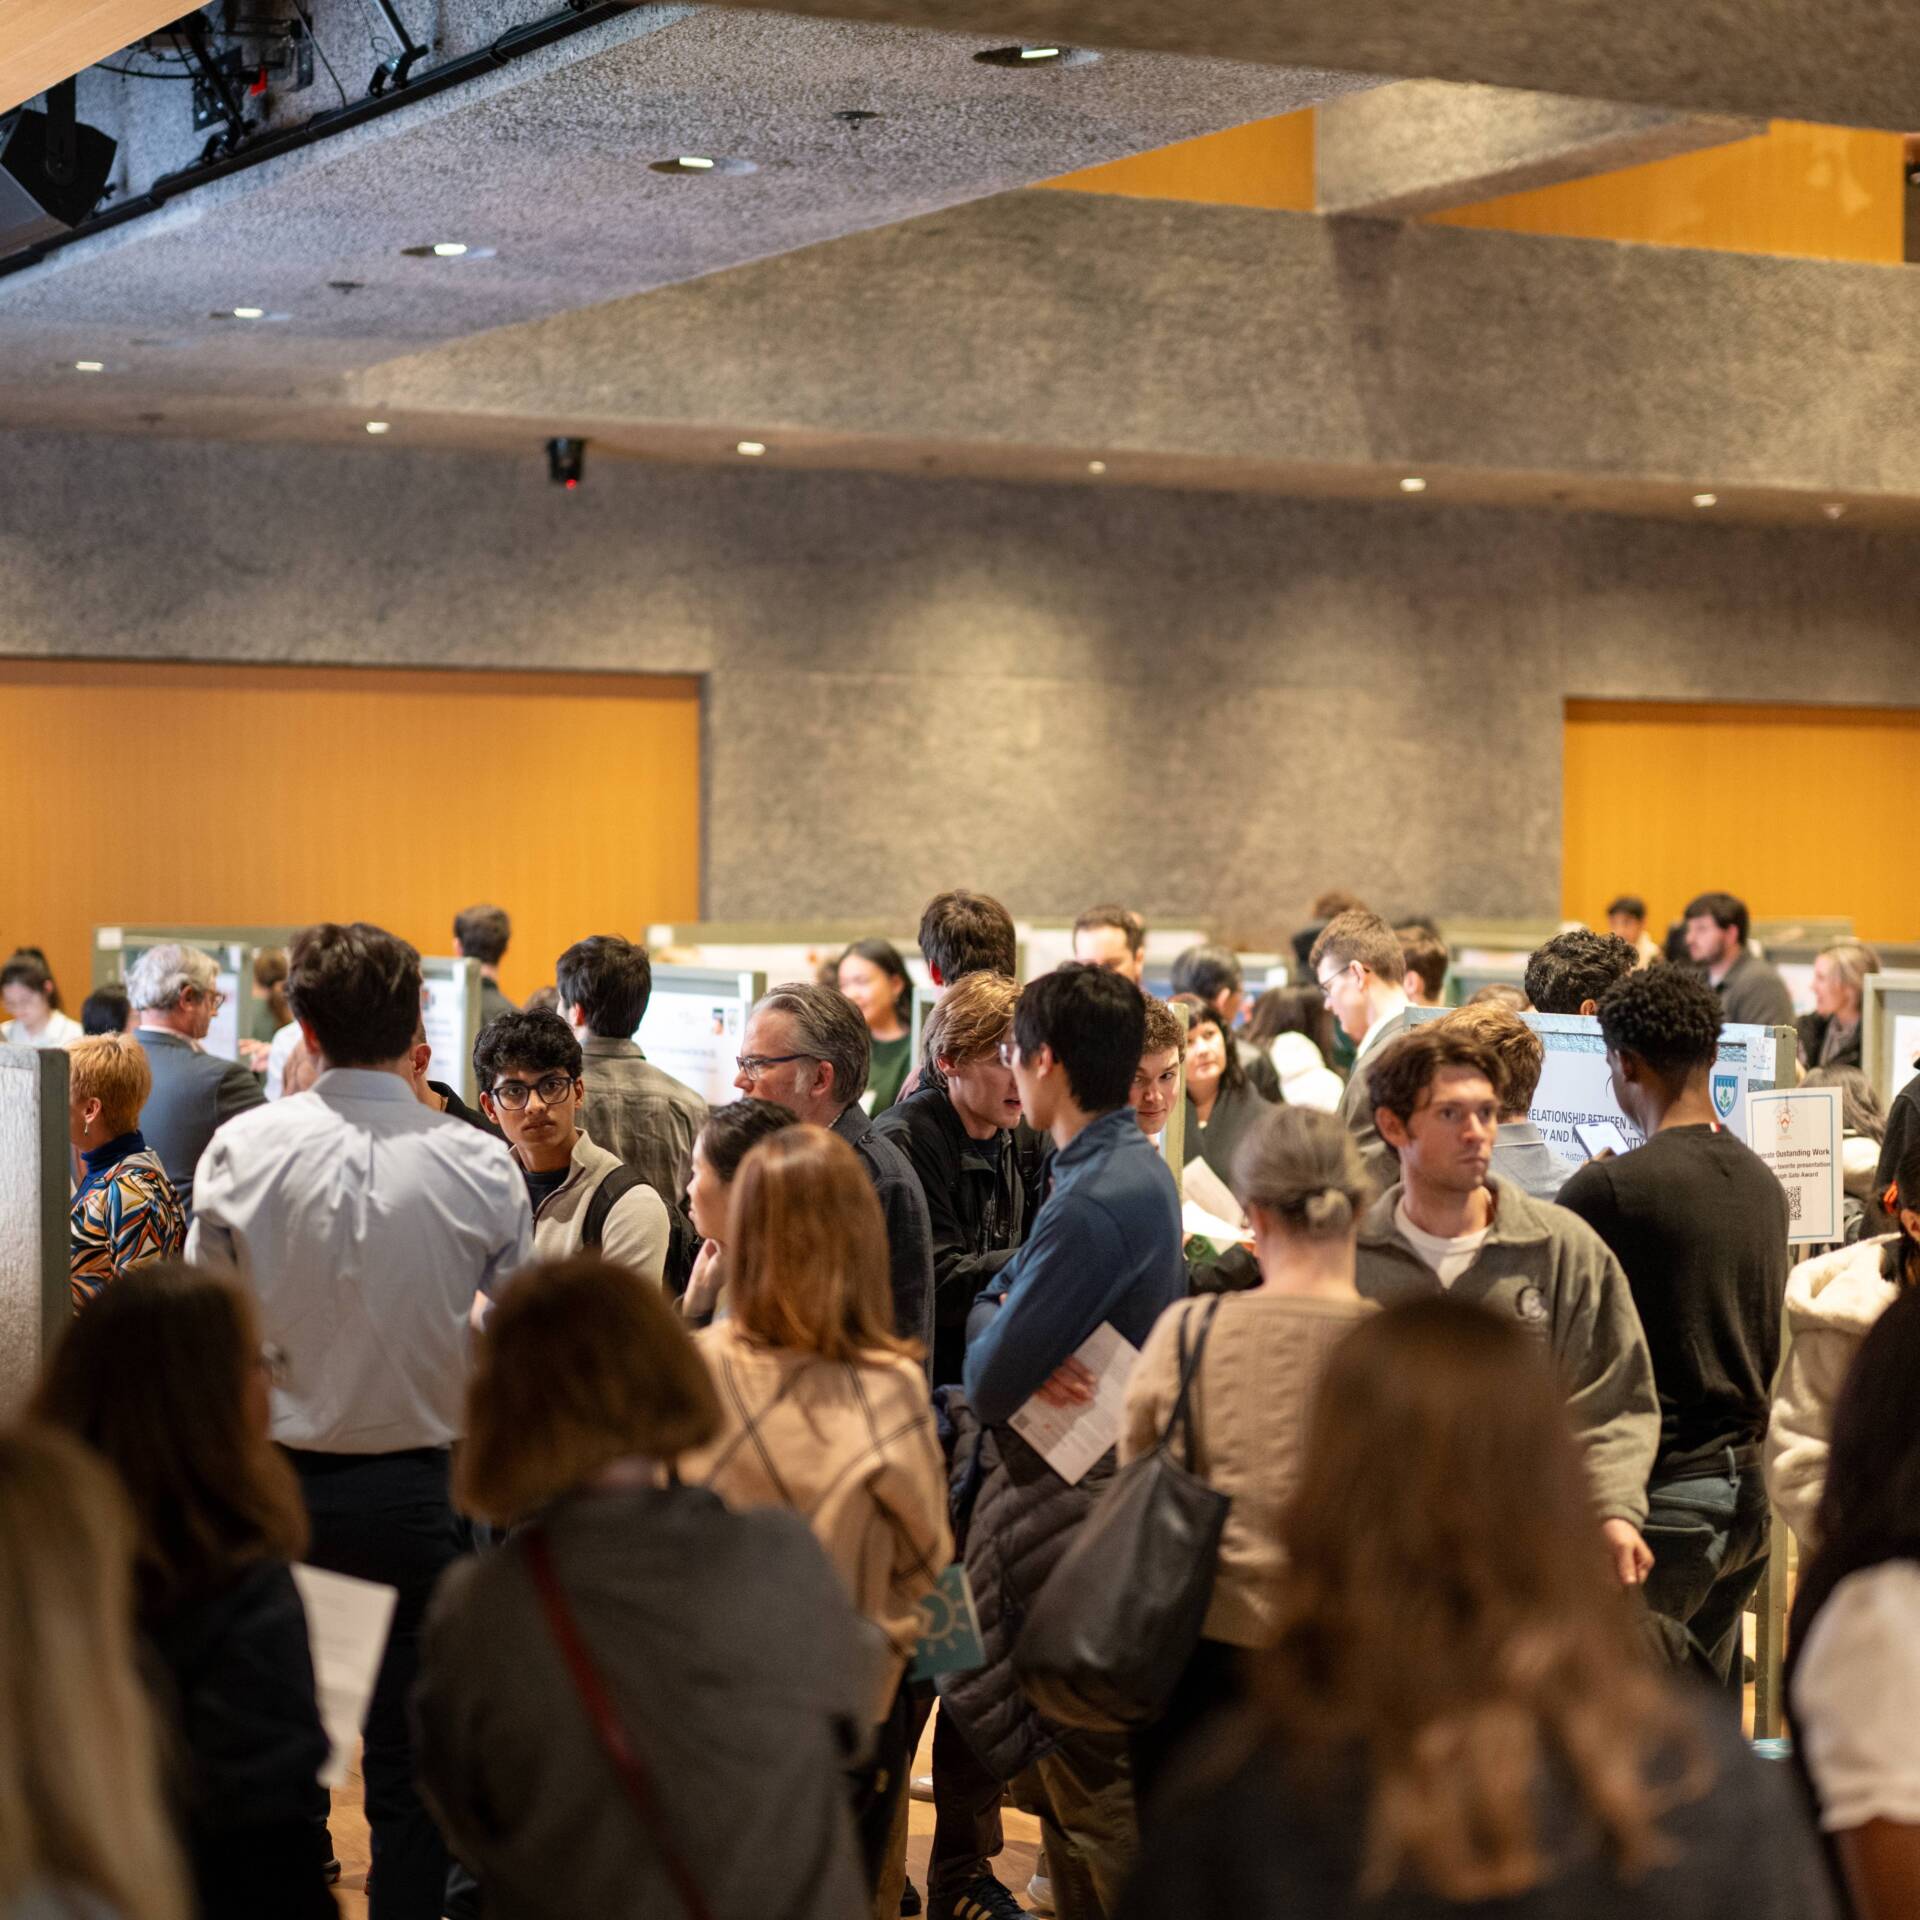
Princeton Research Day – Undergraduate Edition, Photo Credit: Sameer Khan / Fotobuddy
Getting accepted to a conference can feel like the end of a long marathon. After months of conducting research and several iterations of writing, you hit submit, you wait, and you refresh your inbox until finally, the email arrives. You’ve been accepted! Now, you have the opportunity to poster at a conference and share your work with a broader research community.
First of all, congratulations! It is no small feat to get your work reviewed and accepted, and you should be very proud of your accomplishments.
After the excitement and the celebration, you might be wondering what comes next. Acceptance is not just a milestone, but also the beginning of a series of steps to actually poster at a conference. It’s now time to finalize your submission for publication, decide how you will attend, and determine how you will present your research. I hope this practical guide helps you navigate the steps after acceptance.
Last semester, as a sophomore in the Electrical and Computer Engineering Department, I completed my first independent research project as part of the Sophomore Independent Work (ECE 298) with Swan Labs, a lab that works on next-generation wireless systems by combining electromagnetics, signal processing, and system-level design to build fast, intelligent, secure, and adaptable wireless technologies. While I had done research in high school before, this was my first time engaging in research within a truly structured academic setting. The experience felt fundamentally different from anything I had done previously, and it reshaped how I understand what research really means.
“Welcome to SWE23” sign at the Annual Society of Women Engineers National Conference
When I attended my first conference, I was overwhelmed by the number of events—from keynote speakers and lightning talks, to career fairs and research presentations. Over time, through attending several conferences, I learned how to navigate these spaces strategically and make the most of the few days I had at each one. Conferences are an opportunity to connect your academic interests to real-world communities and open doors for future opportunities. From resume databases to poster sessions, conferences can open doors to new research and career opportunities.
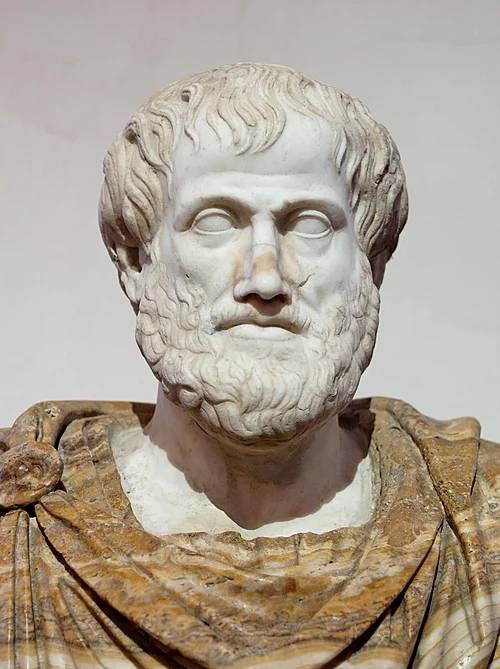
Roman copy of a Greek bronze bust of Aristotle by Lysippos (c. 330 BC).
Aristotle’s Metaphysics begin with an oft-quoted adage: πάντες ἄνθρωποι τοῦ εἰδέναι ὀρέγονται φύσει (Aristotle, Metaphysics A.1 980a). “All humans, by their nature, strive to understand.”
With some spare time over fall break, I decided to brush up on my Greek philosophy. My upcoming junior independent work will focus on Lucretius’ philosophical poem De Rerum Natura, and he engages with so many ideas from ancient Greek thinkers – Epicurus, Democritus, Plato, and Aristotle, to name a few – I thought it prudent to be familiar with them. Given that the very purpose of their works is to explain their ideas, I didn’t expect to run into serious trouble as I began reading them. Instead, as I started making my way through Aristotle’s Metaphysics and Plato’s Timaeus, I found myself entangled with ideas of identity, causation, and substance. My overwhelming reaction was… “wait, what?”
Princeton Research Day is a campus-wide celebration of research and art from Princeton undergraduates, graduate students, postdoctoral fellows, and early career staff. PRD is open to the public, and videos are online now! We hope you consider checking out the channel and voting for your favorite. PRD is celebrating its ten-year anniversary, and we are very excited to come together to showcase the new innovations, findings, and creative work of the Princeton community.
All PRD presenters submit a 3-minute video highlighting one story about their research or art. The videos are designed for broad audiences, demonstrating the importance of research accessibility. If you are local to the area, many presenters will also be talking about their work during our poster session on Thursday, May 8 in the Frist Campus Center from 12:00-1:00.
I have yet to print my senior thesis, but once I do, I’ll be taking a photo with it in front of Blair Arch (per tradition!). Photo by author.
When I sat down to write the acknowledgements for my senior thesis, I realized something surprising: my department’s resources on how to write a thesis or independent work paper didn’t include any advice on writing this section. In some ways, that makes sense. Most readers focus on sections like the abstract, methodology, and results, which really serve as and highlight the key contributions of the paper. But having guidance on how to write acknowledgements can go a long way in helping students thank the people who made their research possible. In this article, I’ll share a few tips for writing acknowledgements—whether you’re submitting a STEM paper to a conference or wrapping up your senior thesis.
A figure of national research stations in Antarctica, which I recently created for my research using the Python library Cartopy.
Ever since I was a child, I’ve always loved maps—I was a major geography nerd growing up. Jumping forward to today, my like-minded roommates are just as obsessed as I am: the walls of our dorm are literally covered floor to ceiling with maps. These include (but are not limited to) a glaciological map of Antarctica, public transport maps of numerous cities (Toulouse, Christchurch, and New York are just some examples), and a road map of my home state of Washington!
Maps aren’t just a fun hobby: They’re also enormously important in numerous research fields (in addition, of course, to just being plain useful). Whether your research field of interest is history or meteorology or epidemiology, there’s a good chance that you’ll be reading—and making!—some maps. In my own field of glaciology, maps are of paramount importance, whether it’s a map of glacier melt contribution from southeast Alaska or a map of Antarctic ice core sites. I’ve written this guide to provide some helpful resources and tools for making maps for your research, so hopefully it will serve as a good starting point! I should note that this isn’t a tutorial, but plenty of great tutorials should exist on the Internet for all of these tools.